> For the complete documentation index, see [llms.txt](https://docs.buildings.ability.abb/collection/llms.txt). Markdown versions of documentation pages are available by appending `.md` to page URLs; this page is available as [Markdown](https://docs.buildings.ability.abb/collection/academy/value-mapping-in-eliona.md).
# Value Mapping in BuildingPro Suites
Value mapping allows raw data (e.g., numerical or boolean values) to be translated into meaningful colors, texts, or categories. This function is used to display information more clearly—for example, in widgets, floors, or attributes.
## Value Mapping for Attributes
Value mapping for attributes automatically translates numerical values into descriptive texts. These texts can be displayed in many places in BuildingPro Suites—e.g., in the Smart View, in widgets, or in the detail view of an asset—and help to present technical measured values in an understandable way.
### Purpose
Value mapping in *Eliona* automatically translates numerical values of an attribute into descriptive texts. This representation makes technical measured values more understandable and facilitates their interpretation in everyday life. The texts appear, for example:
* in the *Smart View*,
* in widgets,
* in the detail view of an asset.
Configuration is done either directly in the attribute or centrally via the [-> Asset modeling](/collection/mandatory-base/assets/asset-modeling-create-templates.md).
### Configuration
In **\[A]**, multiple mapping fields can be added.
A mapping consists of pairs of **limit value → result text**:
* **\[B]** Left field: The limit value that serves as the upper bound for a value range
* **\[C]** Right field: The text that should be displayed if the measured value is below the corresponding limit value
The rule is:
> All values that are **less than** the defined limit value are assigned to the respective text.
**Note on order** The entries do not have to be sorted manually—*Eliona* internally interprets the mapping list correctly, from the **highest to the lowest limit value**. The order of the input lines is therefore **not decisive** for the logic, but it is for clarity during configuration.
### Example evaluation
Given the following configuration:
| Limit Value | Result |
| ----------- | ---------------- |
| 100 | Critical |
| 50 | Warning |
| 10 | Normal Operation |
**Evaluation:**
* A value of **7** → Normal Operation
* A value of **30** → *Warning*
* A value of **75** → Critical
* A value of **99.9** → Critical
* A value of **101 or more** → *No mapping*, the original value is displayed (if no higher limit value is defined)
#### Notes
* The entries should be defined without gaps if every value is to be assigned to a text.
* If no mapping applies, the original value is displayed.
***
## Value Mapping in Widgets
In widgets, a **value mapping** can be used to interpret numerical data both **visually (color)** and **semantically (text)**. This assignment improves the readability of values and supports a faster assessment of the status.
### Purpose
The mapping allows for a clear classification of numerical values into categories—such as "Normal Operation," "Warning," or "Critical." In addition, each status can be assigned its own color, which is immediately recognizable in the display (e.g., progress bar or number field).
### Use case
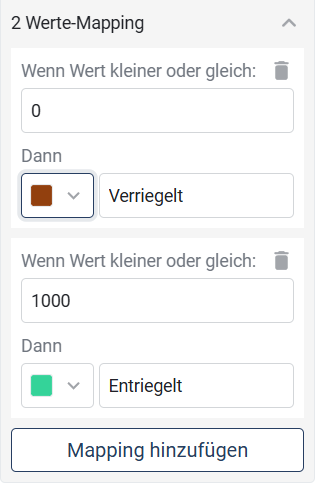
#### Visualize door status with value mapping
This mapping assigns the text *Locked* with a brown display to all values ≤ 0, while values up to 1000 are displayed with *Unlocked* and a green color. In practice, this means that:
* Sensor values such as `0` → *Locked*
* Sensor values `1` to `100` → *Unlocked*
{% hint style="info" %}
The mapping can be expanded as desired by clicking on **"Add mapping."** Make sure that the value ranges are covered without gaps if every possible value is to be assigned.
{% endhint %}
### Display in the Widget
In a widget, e.g., in the overview of a building, the following appears immediately visible for each door (front or back entrance):
* **Text**: *Locked* or *Unlocked*
* **Color**: Visual highlighting to match the status
***
## Value Mapping on the Floor (POIs and Polygons)
In the *Floor* module, areas of a digital plan—such as **polygons** or **POIs**—can be automatically colored depending on the current attribute value. This is done via **value mapping**, in which numerical values are assigned to specific **colors**. The color visualization helps to quickly recognize statuses directly in the spatial context.
### Purpose
This function allows for the display of statuses or measured values directly in the context of a floor plan or building area. The color coding helps to recognize critical situations more quickly or to visually confirm normal operating statuses.
Examples:
* Color-code temperature ranges in production facilities
* Highlight power consumption of individual devices
* Clearly display door or window status
### Configuration
Configuration is done directly in the POI or polygon editor on the floor. Under the *Value Mapping* section, you can define value limits to which a color is assigned:
* **Limit value:** Defines the upper limit of a value range
* **Color:** The color that is applied when the measured value is less than or equal to the limit value
### Example configuration
This configuration means:
* Values less than or equal to 90 → **Green**
* Values less than or equal to 93 → **Yellow**
* Values less than or equal to 10000 → **Red**
#### Notes
* The color mappings apply exclusively to numerical data.
* The color display does not replace numerical values, but supplements them visually.
* If no suitable limit value is found, the selected **default color** is displayed
---
# Agent Instructions
This documentation is published with GitBook. GitBook is the documentation platform designed so that both humans and AI agents can read, navigate, and reason over technical content effectively. Learn more at gitbook.com.
## Querying This Documentation
If you need additional information that is not directly available in this page, you can query the documentation dynamically by asking a question.
Perform an HTTP GET request on the current page URL with the `ask` query parameter, and the optional `goal` query parameter:
```
GET https://docs.buildings.ability.abb/collection/academy/value-mapping-in-eliona.md?ask=&goal=
```
`ask` is the immediate question: it should be specific, self-contained, and written in natural language.
`goal` is optional and describes the broader end goal you are ultimately trying to accomplish on behalf of the user. GitBook uses it to tailor the answer towards what is most useful for that goal.
The response will contain a direct answer to the question and relevant excerpts and sources from the documentation.
Use this mechanism when the answer is not explicitly present in the current page, you need clarification or additional context, or you want to retrieve related documentation sections.
.png?alt=media&token=83c1ba6f-5449-4f88-84b0-7f18905e24c4)