For the complete documentation index, see llms.txt. This page is also available as Markdown.

📊Dashboard

What is a dashboard?

The dashboard is the first thing you see when you log in to eliona.

Dashboards are graphical interfaces on which you can view values, make settings, and recognize connections.

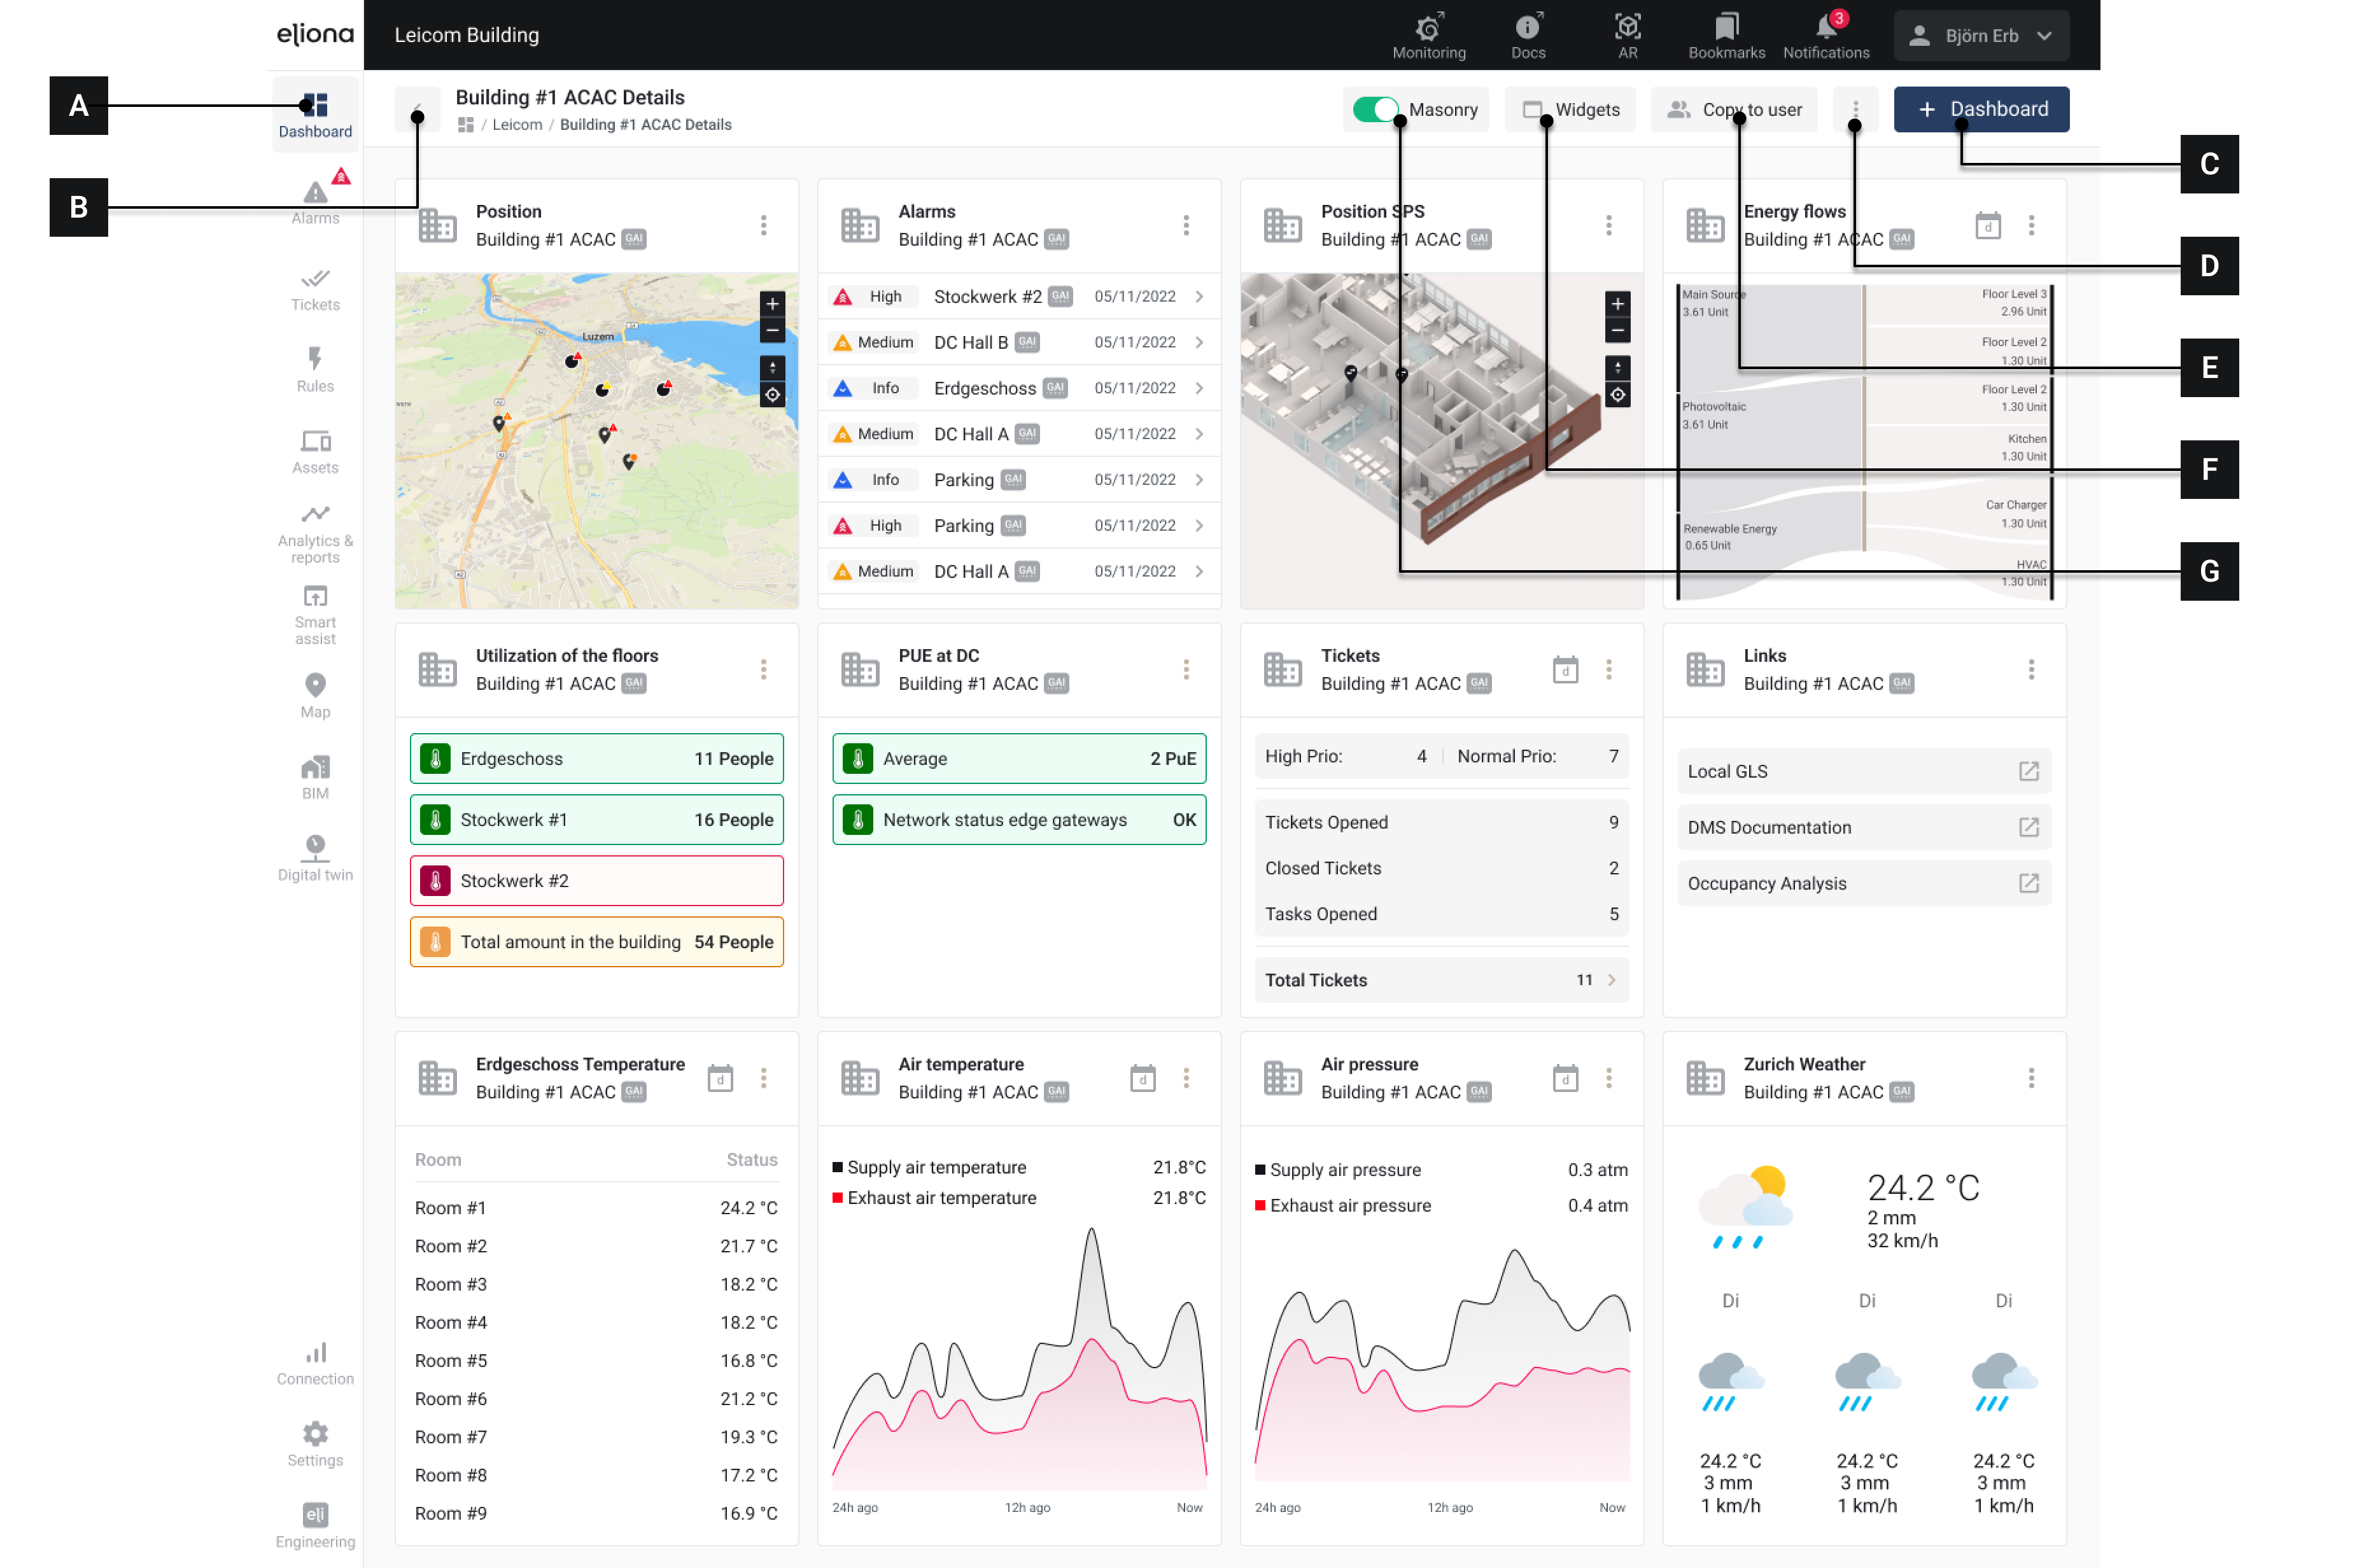
A dashboard with various widgets

[A]

Menu item "Dashboards"

Click here to open the current dashboard

[B]

To the dashboard collection

Click to display all available dashboards

[C]

Button "Create new dashboard"

Create new dashboard

[D]

Options

Available selection:

  • Copy

  • Edit name

  • Add to bookmarks

  • Remove

[E]

Copy to user

Copy current dashboard to a user

[F]

Widgets

Available -> Widgets show

[G]

Masonry Switch

Dashboards consist of so-called -> Widgets. You can individually "assemble" a dashboard from various widgets.

You can return to the dashboard at any time by clicking the menu item Dashboard [A] in the sidebar.

Multiple dashboards

You can create as many dashboards as you like and switch between them.

You are not tied to a single dashboard.

Example You create a dashboard on which the current states of all blinds in your building are displayed.

In another dashboard, you display room temperatures and the status of any air conditioning systems present.

In yet another dashboard, you monitor the energy flows in the infrastructure.

You can -> copy dashboards to other users. This means you do not have to create dashboards that you have already made separately for each user.

Was this helpful?