> For the complete documentation index, see [llms.txt](https://docs.buildings.ability.abb/collection/llms.txt). Markdown versions of documentation pages are available by appending `.md` to page URLs; this page is available as [Markdown](https://docs.buildings.ability.abb/collection/english-v14/documentation/widgets/vordefinierte-widgets/sankey-diagramm.md).
# Sankey diagram
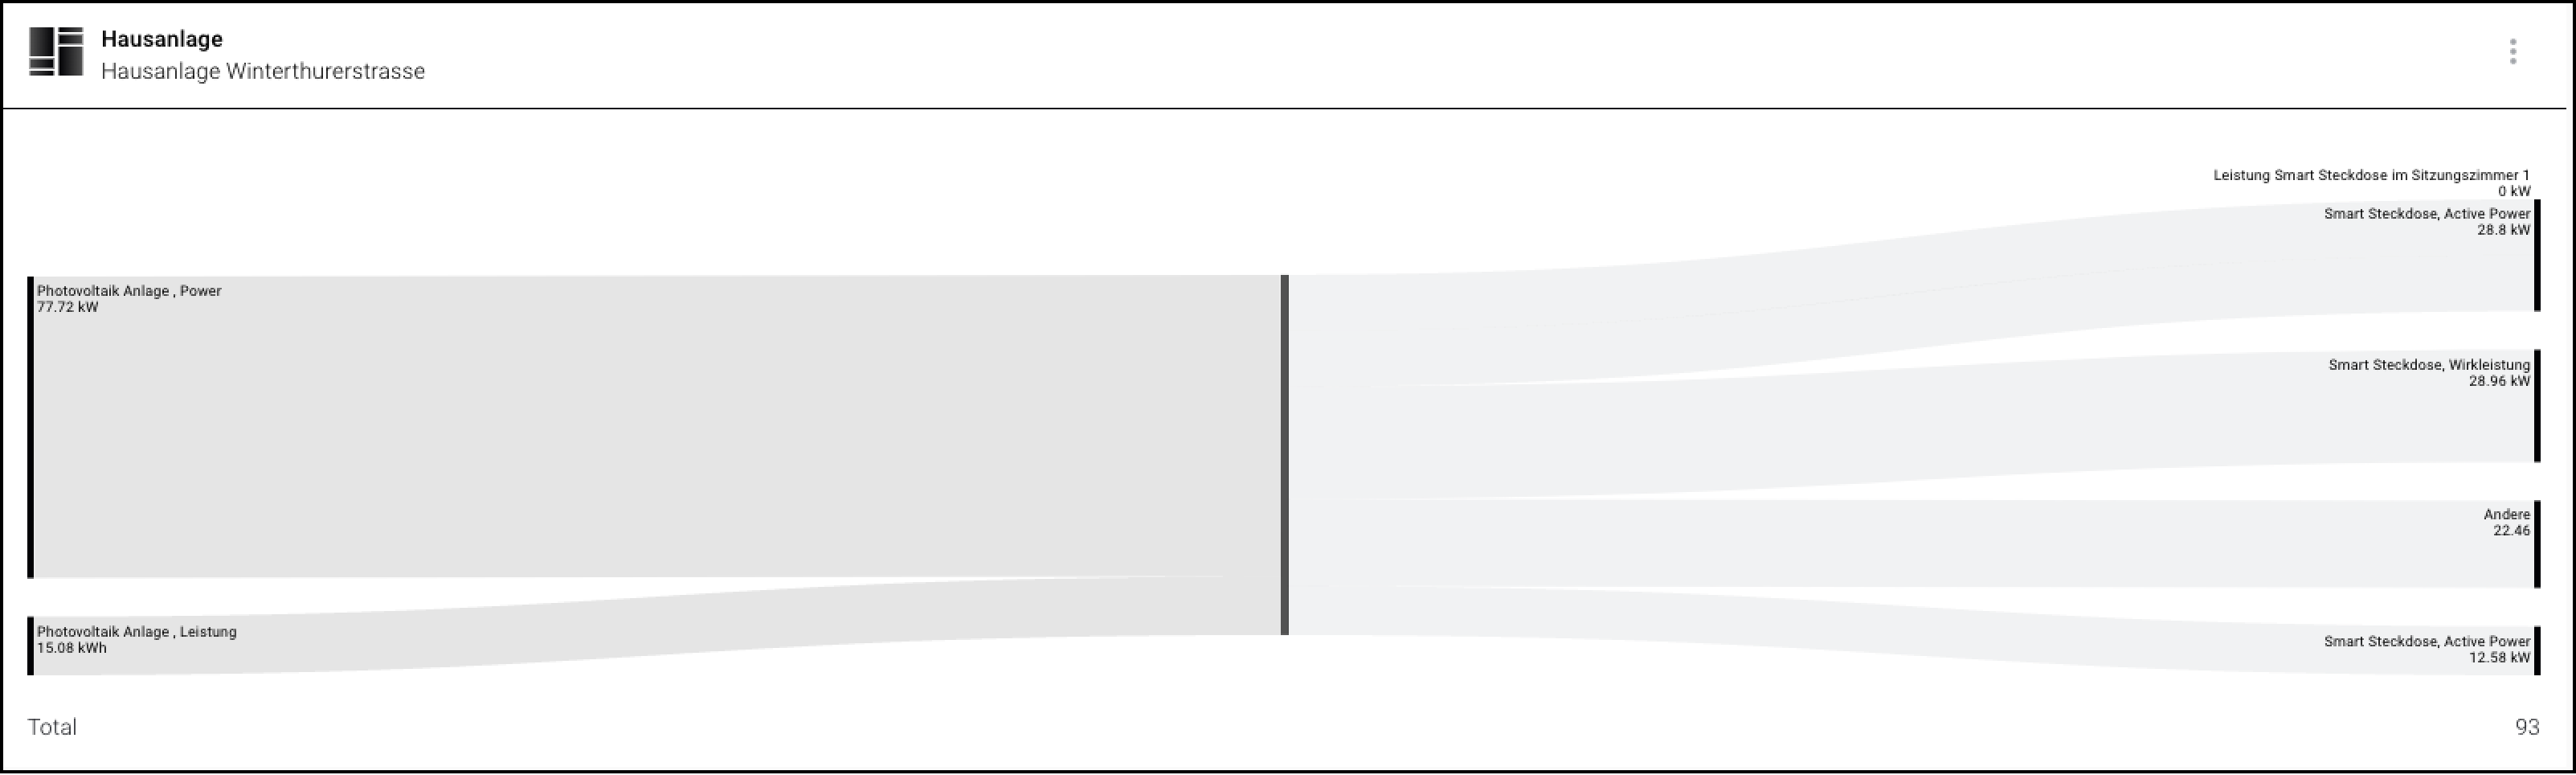
Sankey diagrams are particularly well suited to representing inflows and outflows to a quantity.
Since the inflows and outflows are represented by arrows whose thickness is proportional to the quantity, energy flows, for example, can be made intuitively understandable.
A Sankey diagram with 2 inflows (left) and several outflows (right).
## When should this display be used?
The Sankey diagram should be used when you want to display energy and material flows. Sankey diagrams are excellent for showing how much of the total output is consumed by individual consumers.
## Configure widget
{% @supademo/embed url="" demoId="\_yIBx6mWTACoiIBCX7jqX" fullWidth="true" %}
1. Make sure you are in the "Dashboard" menu
2. Click "Add widget"
3. Click on "View"
4. Click on "Sankey overview"
5. Select the primary asset. The name of this asset will appear in the widget title bar.
6. Select an asset that should act as the source.
7. Select the source attribute.
8. Select whether the current value or the aggregated value should be used for calculations.
9. Optional: Repeat the last steps to create another source.
10. Select an asset that should act as the sink. A sink can, for example, be a consumer.
11. Select the sink attribute.
12. Select whether the current value or the aggregated value should be used for calculations.
13. Optional: Repeat the last steps to create another sink.
14. Optional: Choose how much space your new widget should take up on the dashboard.
15. Click "Add widget"
---
# Agent Instructions
This documentation is published with GitBook. GitBook is the documentation platform designed so that both humans and AI agents can read, navigate, and reason over technical content effectively. Learn more at gitbook.com.
## Querying This Documentation
If you need additional information that is not directly available in this page, you can query the documentation by asking a question.
Perform an HTTP GET request on the following URL with the `ask` and `goal` query parameters:
```
GET https://docs.buildings.ability.abb/collection/english-v14/documentation/widgets/vordefinierte-widgets/sankey-diagramm.md?ask=&goal=
```
`ask` is the immediate question: it should be specific, self-contained, and written in natural language.
`goal` is what the user is ultimately trying to achieve, the reason they need the answer. Sharing it helps GitBook give you a better, more relevant answer. A goal is most helpful when it describes the outcome the user wants rather than restating the question. For example, with `ask=how do I create an API token`, a goal like `automate deployments from our CI pipeline` lets GitBook tailor the answer to that use case.
The response will contain a direct answer to the question and relevant excerpts and sources from the documentation.
Use this mechanism when the answer is not explicitly present in the current page, you need clarification or additional context, or you want to retrieve related documentation sections.