> For the complete documentation index, see [llms.txt](https://docs.buildings.ability.abb/collection/llms.txt). Markdown versions of documentation pages are available by appending `.md` to page URLs; this page is available as [Markdown](https://docs.buildings.ability.abb/collection/english-v14/new-features/changelog-aktuelle-version-v14.2.5.md).

# Changelog – Current version: v14.2.13

## 20260708 – Changelog \[v14.2.13]

With this version, the **Service Desk** has been extensively expanded. Tickets and tasks can now be planned more precisely, working times recorded more transparently, and managed more clearly. New notifications help keep deadlines and completed work in view. At the same time, the views and workflows have been revised so that important information can be found more quickly and recurring tasks can be completed more efficiently.

### **Due dates and automatic notifications**

For tickets and tasks, a fixed due date or a period can now be defined. Overdue entries are clearly marked in the overview, making urgent tasks immediately recognizable. Completed or canceled tickets and tasks are no longer shown as overdue.

In addition, new notifications are available. The responsible user can be informed when a ticket or task is overdue. The ticket owner can also receive a message as soon as all related tasks have been completed. Which notifications are sent can be defined centrally in the ticket and task settings.

{% content-ref url="/pages/605ee169b4ffa284e55d63371e192f83932649e0" %}
[Ticket and task settings](/collection/english-v14/documentation/tickets/ticket-einstellungen.md)
{% endcontent-ref %}

### **Automatically sum and adjust working times**

The working times recorded for individual tasks are now automatically added to the total time of the ticket. This makes it immediately clear how much time was spent in total on a work order.

If the calculated time does not match the billable or actually reported effort, the total time can be adjusted manually. Users with administrative rights continue to see both the calculated and the adjusted value. For users with read-only access, only the adjusted time is displayed.

{% content-ref url="/pages/26b140bfee636c82b984a19b89d6c3fb547279de" %}
[ticket details](/collection/english-v14/documentation/tickets/ticket-details.md)
{% endcontent-ref %}

### **Clearer ticket management and extended export**

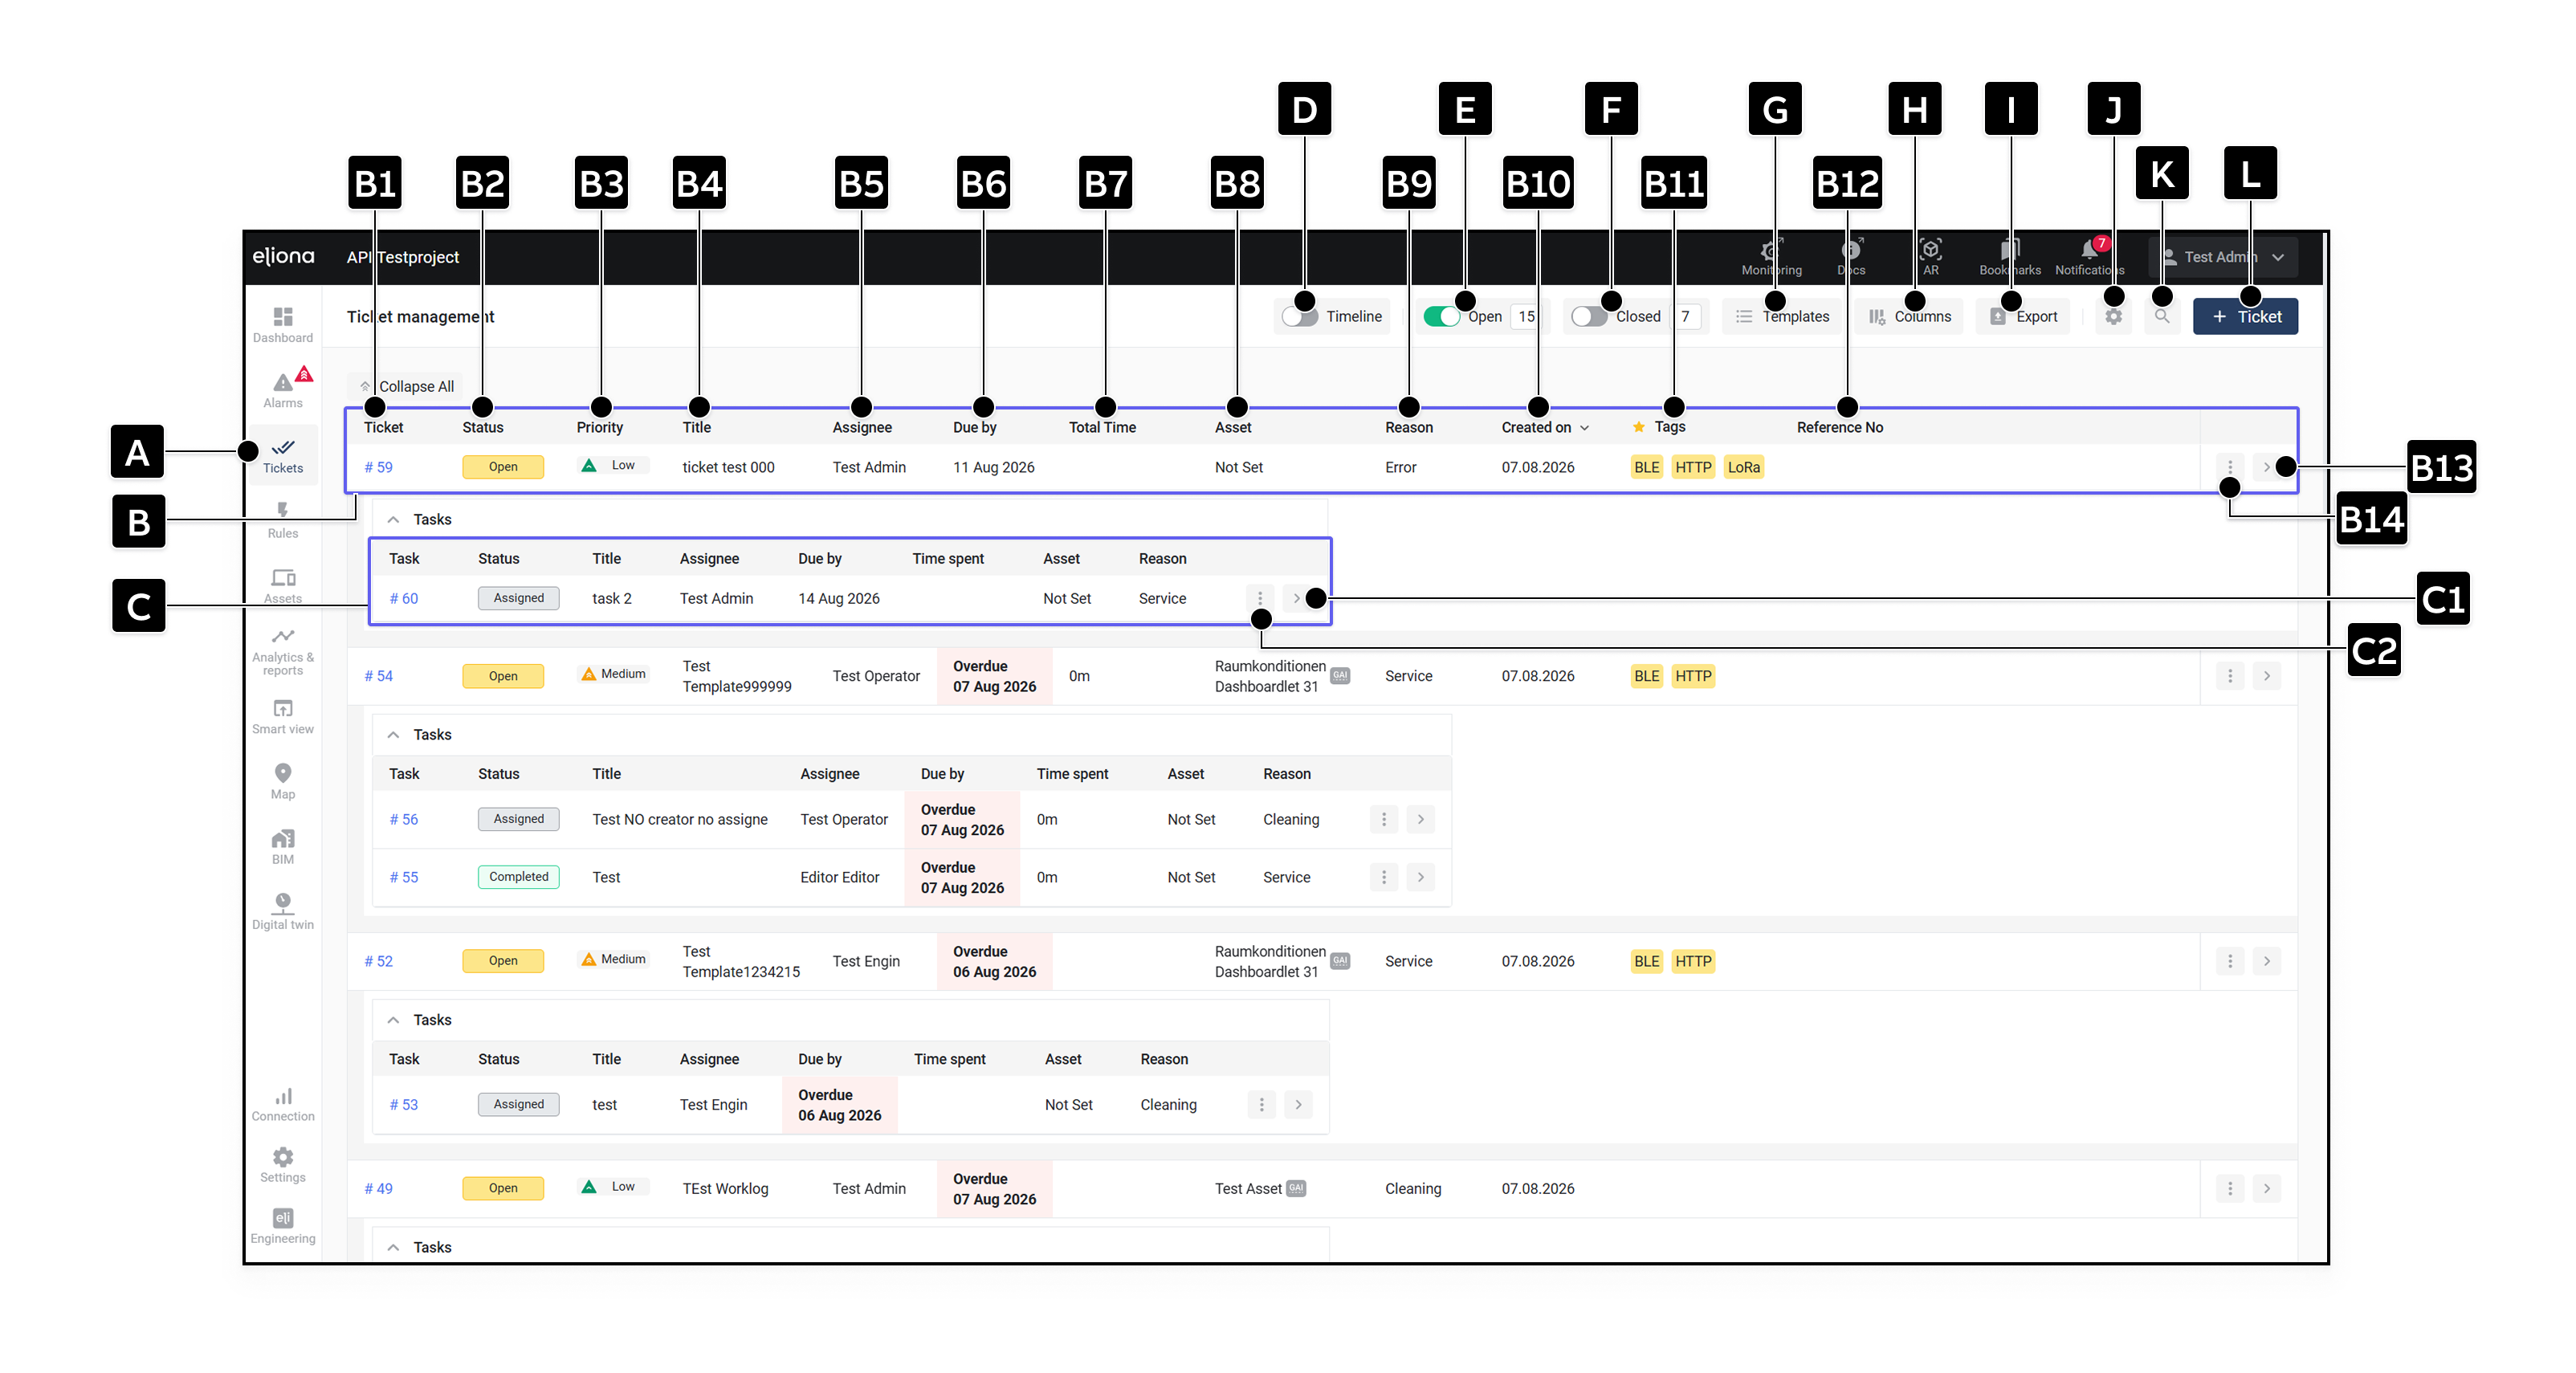
<div align="left"><figure><img src="https://156899794-files.gitbook.io/~/files/v0/b/gitbook-x-prod.appspot.com/o/spaces%2FNyvwhz1kEMXcHf4HLuZ8%2Fuploads%2Fgit-blob-33cc6c5dc9420b8b1bb1895c68ef7347b53831e7%2FTicket%20managemant.png?alt=media" alt="Überarbeitete Ticketverwaltung"><figcaption><p>The revised ticket management</p></figcaption></figure></div>

The ticket overview can now be adapted more flexibly to the respective workflow. In addition to the ticket columns, the columns of the underlying tasks can also be selected and arranged in the desired order. In the overview, only tags from favorite categories are displayed, keeping the list clear even when many tags are assigned.

The export takes the current filters into account and includes additional information such as due periods, ticket descriptions, task creation dates, and manually adjusted working times. Tickets can also be assigned a freely definable reference number in order to link them, for example, to external orders or processes.

{% content-ref url="/pages/d60773e53a548978613495e8568c83a9b3f8eeb5" %}
[tickets](/collection/english-v14/documentation/tickets.md)
{% endcontent-ref %}

### **Improved collaboration and clearer permissions**

Tasks can now be accepted, completed, or canceled not only by the assigned user, but also by their creator. Users with the permission **Ticket Manage** can also manage task statuses and delete their own tickets. This makes it easier to organize substitutions and work orders handled jointly.

The ticket and task details have been restructured. Navigation, actions, comments, and the work log are now easier to access. The forms have also been revised with clearer labels, placeholders, and hints for optional information.

{% content-ref url="/pages/08e3b1a210623f29b4478afbd5edbf90ea8de020" %}
[Rights for tickets and tasks](/collection/english-v14/documentation/tickets/rechte-fuer-tickets-und-tasks.md)
{% endcontent-ref %}

### **Further improvements**

* Detection of overdue tickets and tasks has been improved.
* Recorded and manually adjusted working times are updated and checked more reliably.
* Creating tasks and the associated permission check have been stabilized.
* Labels and translations in the ticket area have been revised in German, French, Italian, and English.

## 20260409 – Changelog \[v14.2.5] <a href="#id-20260226-changelog-v14.2.2" id="id-20260226-changelog-v14.2.2"></a>

* Alarm Statistics: Fix for reliable forwarding for the default time range to alarm history from the frequency and duration table.

## 20260330 – Changelog \[v14.2.4] <a href="#id-20260226-changelog-v14.2.2" id="id-20260226-changelog-v14.2.2"></a>

* Alarm Statistics: Fix for reliable forwarding to alarm history from the frequency and duration table.
* Alarm Statistics: Translation of the alarm texts column in the frequency and duration table.

## 20260307 – Changelog \[v14.2.3] <a href="#id-20260226-changelog-v14.2.2" id="id-20260226-changelog-v14.2.2"></a>

* Note: No functional changes, only adjustment of the container registry/build pipeline.

## 20260226 – Changelog \[v14.2.2] <a href="#id-20260226-changelog-v14.2.2" id="id-20260226-changelog-v14.2.2"></a>

* In alarm history, the keyword search was extended with the asset name.
* In the alarm statistics, "Alarm Message" and "Priority" were added to the alarm frequency table; in addition, an incorrect redirect from the statistics to the history was fixed.
* In general, the sorting of the tag list according to the configured category order was corrected.
* In Engineering, a permission issue was fixed in which users in the list could incorrectly gain access to the navigation item "Engineering".
* In the API, the update of CalculationRules was fixed
* In the database, the rebuild of the escalation matrix on escalation target updates was fixed; in addition, a new MQTT ACL is now created automatically when an MQTT account is created.
* Note (security / backward compatibility): The legacy endpoints `/xovis/*` and `/niagara/*` are automatically redirected to the protected endpoints under `/apps/<app>/api/...` redirected.

The following bug fixes were made in this version:

## 20251216-Changelog \[v14.2.1]

### **Digital Twin – Public and user-specific Digital Twins**

The new public and user-specific [-> Digital Twins](/collection/english-v14/documentation/digitaler-zwilling.md) are here. Similar to well-known [→ Public Dashboards can](/collection/english-v14/documentation/dashboard/globale-dashboards.md) Digital Twins can now be provided either project-wide or used individually per user. This allows Digital Twins to be managed centrally while still being flexibly adapted to different user needs.

When creating a Digital Twin, two variants can be distinguished:

* **User:** The Digital Twin is visible only to the respective user.
* **Project:** The Digital Twin is visible to all users in the project.

Only the creator can edit or delete public Digital Twins.\
Digital Twins can still be copied specifically to other users, and the visibility status can also be changed later.

### **Further changes and fixes:**

* The [Image-](/collection/english-v14/documentation/widgets/vordefinierte-widgets/bild.md) and the [Iframe-](/collection/english-v14/documentation/widgets/vordefinierte-widgets/iframe.md)widget were revised and visually improved.
* The size of downloaded analysis images has been improved.
* A bug in alarm counting in charts and in the reporter was fixed.
* The performance of alarm SSE events was improved.
* The [-> Sankey diagram](/collection/english-v14/documentation/widgets/vordefinierte-widgets/sankey-diagramm.md) now supports displaying [CUSUM data](/collection/english-v14/academy/aggregationen-in-eliona.md#kumulativzahler-cumulative-counter).

## 20250818– Changelog \[v14.2.0]

We are pleased to **Eliona v14.2.0** introduce — an update with new features, optimized interfaces, and targeted improvements in the areas of *Script Engine*, *Dashboard*, *Asset Management*, *Escalation Management*, *Analytics* and *Audit Trail*.\
With this version, script creation becomes more convenient, view configuration more flexible, and handling of escalations and tracking of changes in the system even more transparent.

[→ Link to the full changelog v14.2.0](https://deploy.eliona.io/helm/changelogs/v14.2.txt)

### **Autocomplete and view switching in the Script Engine**

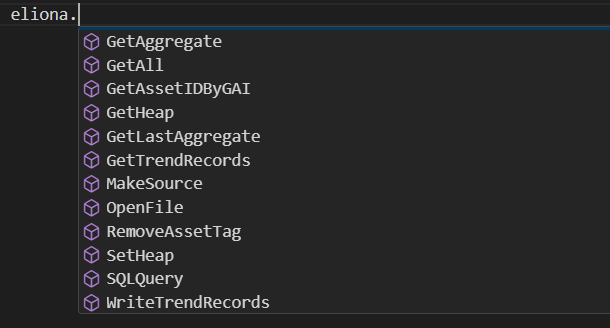
The *Script Engine* supports rudimentary autocompletion for Python scripts. During input, suitable functions, methods, and variables are suggested automatically, which makes development easier and reduces typos.

<div align="left"><figure><img src="https://content.gitbook.com/content/Nyvwhz1kEMXcHf4HLuZ8/blobs/dmVDmnWUSl3Vv6L35Kqi/image.png" alt="" width="305"><figcaption></figcaption></figure></div>

Additionally, a switch option between the general view (*General View*) and the pure code view (*Code View*) was integrated — ideal for switching between a clear display and a focused programming mode as needed.

<div align="left"><figure><img src="https://content.gitbook.com/content/Nyvwhz1kEMXcHf4HLuZ8/blobs/U968GPviKLeFZoK6iydC/forecast%20app%20(5).png" alt="" width="163"><figcaption></figcaption></figure></div>

{% content-ref url="/pages/22d3868e275c5107ec0cd6df53a069bfd12708a3" %}
[Configure scripts](/collection/english-v14/documentation/engineering/skript-engine/skripte-konfigurieren.md)
{% endcontent-ref %}

### **Reporter download in the Link Widget**

In the *Link Widget* a report can now be selected as the download target. When a user clicks the link, the stored report is downloaded automatically — quickly and directly from the dashboard, without detours.

<div align="left"><figure><img src="https://content.gitbook.com/content/Nyvwhz1kEMXcHf4HLuZ8/blobs/GFoWLQKksKhtlvFwDCBL/CHangelog.png" alt=""><figcaption></figcaption></figure></div>

{% content-ref url="/pages/4d9a7aede8de0c5602693e490fcf48561990bd66" %}
[Links](/collection/english-v14/documentation/widgets/vordefinierte-widgets/links.md)
{% endcontent-ref %}

### Column configuration and advanced status options for assets

In the *Asset Management* A flexible column configuration is now available, allowing the displayed information to be customized individually. In addition, unmonitored status boxes can be hidden to make the view clearer.

{% content-ref url="/pages/3e77762dc49311586d659dc628a0022299f06eec" %}
[Assets](/collection/english-v14/documentation/assets.md)
{% endcontent-ref %}

### Extended escalation configuration and new layout

<div align="left"><figure><img src="https://content.gitbook.com/content/Nyvwhz1kEMXcHf4HLuZ8/blobs/Ga9DQdBXaXnJwPOgDjOz/CHangelog%20(1).png" alt="" width="563"><figcaption></figcaption></figure></div>

The escalation management has been comprehensively revised and now offers both a new, clearer layout and additional filter options. With the new configuration option, alarms can be combined in a targeted way to make notifications more efficient. Alarms with certain tags — for example *High Prio* — can be excluded from the combination, so that they continue to be escalated individually. Thresholds can also be defined, for example that if 100 incoming alarms arrive within 10 seconds, only one escalation message is sent instead of 100 individual notifications. This significantly reduces notification floods and ensures a clearer overview in alarm handling.

{% content-ref url="/pages/e6e1b849067aba2b868e1a38313521a652c84a2c" %}
[Group escalations](/collection/english-v14/documentation/alarme-regeln-und-eskalationen/eskalationen/eskalationen-gruppieren.md)
{% endcontent-ref %}

### **Use reporting period in Analytics**

<div align="left"><figure><img src="https://content.gitbook.com/content/Nyvwhz1kEMXcHf4HLuZ8/blobs/AcVfX6zbIZAHyaP91LJv/CHangelog%20(2).png" alt="" width="271"><figcaption></figcaption></figure></div>

For embedded analyses in reports, the time period defined in the report can now be adopted directly. Previously, the time period stored in the analysis itself was always used. This new option provides more flexibility and consistency, as analyses automatically take the context of the report into account.

### **Extended Audit Trail**

The *Audit Trail* was supplemented with several entities previously missing, so that changes and activities can now be traced even more completely. Events are now also recorded for:

* Project roles
* System roles
* Tags
* Scripts
* Escalations
* Asset type attributes
* Asset types
* Wayfinding buildings
* Projects

This means that everything is now fully logged, enabling a seamless history and even more precise tracking of all system changes.

{% content-ref url="/pages/f5220317cebe05f4004dc13a757cb3c7b4e4eb32" %}
[Audit Trail](/collection/english-v14/documentation/einstellungen/audit-trail.md)
{% endcontent-ref %}

## 20250624 – Changelog \[v14.1.0]

We are pleased to *Eliona v14.1.0* introduce — an update with numerous improvements in the areas of analytics, security, and system stability. Aggregated data can now be used system-wide, for example in the *Digital Twin* and in rule chains. With the new method *Time Weighted Average* more accurate evaluations over periods are now possible. Two-factor authentication (TOTP) significantly increases access security, and optimized event handling ensures reliable processing of all events — even in the event of temporary disruptions. In addition, evaluations can now be shared and used across projects as global analytics and reports — just like the well-known *Public Dashboards*.

[→ Link to the full changelog v14.1.0](https://deploy.eliona.io/helm/changelogs/v14.1.txt)

### Use aggregated data everywhere – now also in the Digital Twin

In the *Digital Twin* as well as in the *Floor* aggregated values can now be used. This extension allows historical and aggregated data to be visualized directly in the building context. Aggregations such as average, minimum, or maximum are available — ideal for analyzing states over time.

![](https://content.gitbook.com/content/Nyvwhz1kEMXcHf4HLuZ8/blobs/Kl1zbwHJFvq90tQQrKCd/Digitaler%20Zwilling%20Link.png)

[→ Use aggregations in the Digital Twin](/collection/english-v14/documentation/digitaler-zwilling.md#einen-wert-verknupfen)

### Two-factor authentication with TOTP

Security has been further strengthened: With the new TOTP mechanism (Time-based One-Time Password), an additional authentication step can now be enabled. This option significantly increases access security for sensitive project data.

Setup is done directly in the **user settings** of your own profile. Once you are logged in, you can activate two-factor authentication there and connect a TOTP-compatible authentication device (e.g. Google Authenticator or Authy).

{% content-ref url="/pages/a4e23a0a95a8e12ef004f189c027784d5aee156f" %}
[Set up 2FA in Eliona](/collection/english-v14/academy/2fa-in-eliona-einrichten.md)
{% endcontent-ref %}

### Global Analytics and Reports

The new *global analyses and reports* are here! As with the well-known [→ *Public Dashboards* ](#public-dashboards)you can now also provide your evaluations project-wide. This allows dashboards, charts, and reports to be managed centrally and made visible to everyone involved in the project.

When creating an analysis or a report, a distinction can be made between "User" and "Project":

* **User**: The analysis is visible only to you personally.
* **Project**: The analysis is visible to all users in the project and marked with a **blue dot** .

Only the creator can edit or delete global analytics.\
Analyses can still be copied specifically to other users, and the visibility status can also be edited later.

{% hint style="info" %}
If an analysis is to be used in the *Analysis Widget* we recommend using a **global analysis** Only then is it ensured that all users with access to the dashboard can also see the analysis.
{% endhint %}

[→ *Use analysis widget*: *Display analysis directly in dashboards*](/collection/english-v14/documentation/widgets/vordefinierte-widgets/analyse.md)

{% content-ref url="/pages/321e1153562898651ddd5486b491a2e3660a960c" %}
[Global Analytics and Reports](/collection/english-v14/documentation/analytics-and-reports/globale-analytics-und-reports.md)
{% endcontent-ref %}

### Time comparison in Analytics – New offset function

With the new *Offset*-option in Analytics, time periods can now be compared directly — for example, today with yesterday or current data with values from the previous year. This allows trends, seasonal fluctuations, or operating behavior to be analyzed even better.

The option is available directly in the analysis configuration and significantly expands the comparison possibilities.

[→ *Use offset function in Analytics*](/collection/english-v14/documentation/analytics-and-reports/analytics-nutzen.md#offset-funktion-in-analytics-verwenden)

### Rules with aggregations

Rules can now be created on the basis of aggregated attributes (average, minimum, maximum). This makes it possible to define conditions that are based not on individual values but on time-series evaluations — ideal for monitoring that responds to trends instead of individual events.

<figure><img src="https://content.gitbook.com/content/Nyvwhz1kEMXcHf4HLuZ8/blobs/aJw7H78voek4OQBVpmn9/Digitaler%20Zwilling%20Link%20(1).png" alt=""><figcaption></figcaption></figure>

[→ Create rule with aggregation](/collection/english-v14/documentation/alarme-regeln-und-eskalationen/regeln/eine-regel-erstellen.md#details)

### New aggregation method: Time Weighted Average (TWA)

With the new aggregation method *Time Weighted Average* (time-weighted average), values can be calculated more realistically over periods — especially when values do not change constantly.

Unlike the normal *Average*, where all values are weighted equally, TWA takes into account **how long a particular value was active**. A value that remains constant for most of the period is therefore weighted more heavily in the average than short-lived outliers.

**Example:**\
If at the start of an hour the value "1" is written and just before the end of the hour the value "60" is written once, the classical *Average* (1 + 60) / 2 = **30,5**.\
TWA, on the other hand, takes into account that the "1" was active for almost the entire hour — the result is then realistically around **2**.

This method is particularly useful for:

* Slowly changing sensor values
* Energy or temperature curves with sudden peaks
* Context-sensitive measurement data, where the duration of a state is crucial

[→ *Use TWA aggregation in Eliona*](/collection/english-v14/academy/aggregationen-in-eliona.md#zeitgewichteter-durchschnitt-time-weighted-average-twa)

### Redesign of the attribute display in the asset

The attribute sidebar in the asset has been redesigned into a dialog. The new layout offers improved clarity, a clearer separation of information, and easier navigation through the attribute details.

### **More reliable event processing in the frontend**

Event processing in the *Eliona*-frontend has been further optimized to function reliably even under difficult network conditions. Unstable connections, browser tabs in the background, or local restrictions previously meant that events were not always displayed immediately in the client.

With the new architecture, Eliona automatically detects when the **browser** is no longer receiving events and automatically restarts local processing. In addition, fallback polling is used to reliably deliver missed or delayed events to the client — without manually reloading the page.

***

## 20250515 – Changelog \[v14.0.5]

The following bug fixes were made in this version:

* In alarms, a bug was fixed in forwarding asset attributes to the alarm messages.
* In escalations, a problem with saving escalation targets was fixed.
* On the home page, elements are now hidden if a user does not have the corresponding permissions.
* In rule chains, a problem in the alarm node that could occur for assets without subtype input attributes was fixed.

## 20250425 – Changelog \[v14.0.4]

In this hotfix, a bug in the rule chain component "Day Schedule" was fixed, which caused schedules within rule chains not to be executed correctly.

## 20250424 – Changelog \[v14.0.3]

In this version, several minor bug fixes and optimizations were made:

* In alarm statistics, the tag filter was extended and now supports logical AND and OR combinations for more precise analysis.
* A problem in the Smart Assist menu where the progress element crashed when there was no heap provider was fixed.
* In the Analytics component, unnecessary reloading of alarm data was suppressed to improve performance.
* A bug when exporting asset data was fixed, so data export now works reliably again.
* When using Smart View via a ShortURL, the user is now logged out correctly when their session has expired.
* The updating of aggregated data in the Smart Assist menu has been improved.

## 20250423 – Changelog \[v14.0.2]

This hotfix fixed a bug in rule management where simultaneously pausing or starting multiple rules on different levels did not work correctly.

## 20250422 – Changelog \[v14.0.1]

In this hotfix, a more stable server file hoster for the Monaco editor was integrated to avoid loading problems and ensure reliable rendering of the editor.

## **20250326 - Changelog\[v14.0.0]**

We are pleased to introduce Eliona v14.0.0! This version brings [**TimescaleDB**](#einfuhrung-von-timescale-automatische-aggregationen-ohne-manuelle-konfiguration) for automatic aggregations without manual configuration, extended [**rule chains**](#erweiterte-regelketten-mehr-moglichkeiten-fur-automatisierungen) with new components and improved management of [**asset characteristics**](#asset-charakteristiken-uberarbeitet-vereinfachte-verwaltung-mit-templates).

With the new [**Analysis Widget**](#neues-analyse-widget-direkte-einbindung-von-analysen-in-dashboards-und-smart-views) analyses can be integrated directly into dashboards and Smart Views, while [**Job Diagnostics**](#job-diagnostics-fur-eskalationen-detaillierte-nachverfolgung-von-notifications) enable detailed tracking of escalations. The [**trending configuration**](#neue-trending-konfiguration-fur-attribute) for attributes improves the storage of historical data, and new [**system settings**](#erweiterte-systemeinstellungen-verbesserte-speicherverwaltung) offer more control over storage and processing options.

In addition, [**Twig templates**](#twig-templates-in-eliona-flexible-nachrichtenerstellung) have been integrated for flexible message creation, the [**Smart Assist menu**](#uberarbeitung-des-smart-assist-menus) revised, and a [**broker configuration page**](#neue-konfigurationsseite-fur-den-eliona-broker) added for secure management of MQTT connections. [External alarms](#alarme-regeln-aus-externen-quellen-jetzt-klar-erkennbar) and rules are now clearly recognizable, and [obsolete structures](#legacy-strukturen-bereinigt) have been removed to make Eliona future-proof.

[→ Link to the full changelog v14.0](https://deploy.eliona.io/helm/changelogs/v14.0.txt)

### Introduction of Timescale – Automatic aggregations without manual configuration

With this version, Eliona introduces **TimescaleDB** Timescale, a powerful time-series database specially optimized for processing large amounts of time-dependent data. This provides **automatic aggregations in real time** without having to configure them individually for each attribute.

<figure><img src="https://content.gitbook.com/content/Nyvwhz1kEMXcHf4HLuZ8/blobs/FEZWhOKClwOQ9Dx34fX6/Offset%20(2).png" alt="" width="375"><figcaption></figcaption></figure>

The introduction of Timescale significantly improves performance and enables efficient processing of large amounts of data. Aggregations are now calculated dynamically and are immediately available in dashboards, Smart Views, Analytics, and rule chains. Manual configuration is no longer required at all, which means the **Asset Editor** as well as all **pipeline settings** were removed.

This change makes it much easier to use aggregated values, as calculations are performed directly in the system and no additional settings are required. Further information on using the new aggregations is available in the corresponding documentation:

{% content-ref url="/pages/0def57698128881e162e5f36480bced52dbf1ec8" %}
[Aggregations in Eliona](/collection/english-v14/academy/aggregationen-in-eliona.md)
{% endcontent-ref %}

### **Extended rule chains – More options for automations**

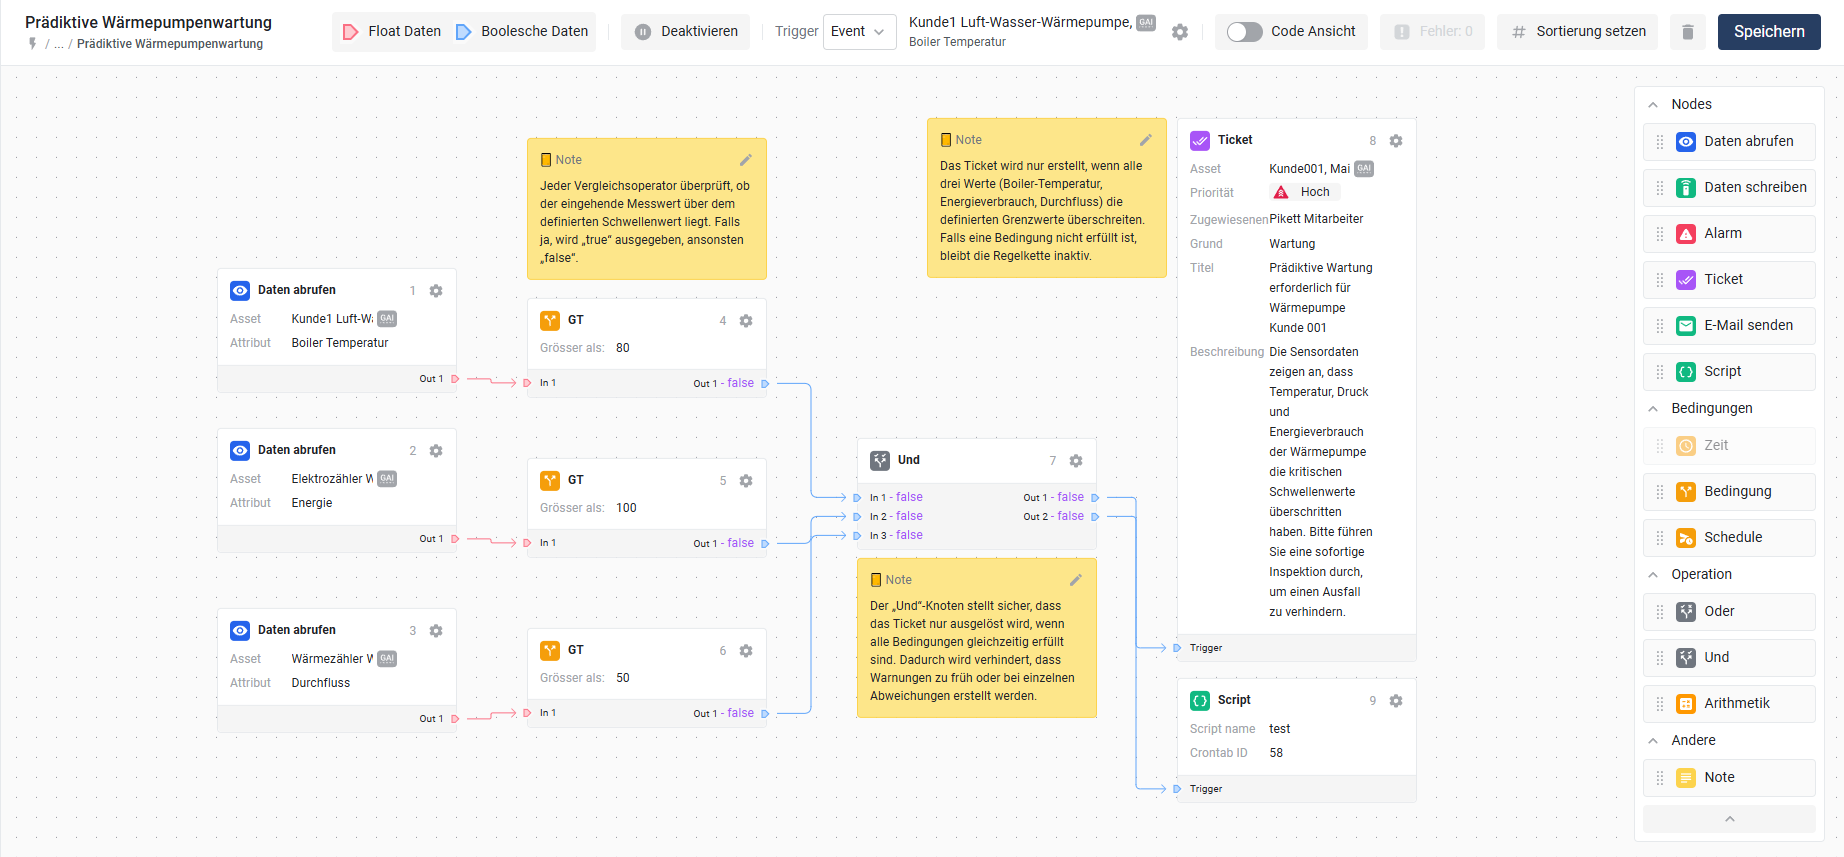
The **Rule Chain Engine** has been extensively expanded:

* New **components**, e.g. **Script-Node**, to execute scripts from the **Script Engine** execute.
* **Notes** can now be added within the rule chain.
* **Live data display** within the rule chain, to see current values directly.\
  These extensions make the rule chains more powerful and enable a **even more flexible automation**.

<figure><img src="https://content.gitbook.com/content/Nyvwhz1kEMXcHf4HLuZ8/blobs/P2V9OYTgMsa8meeQoN4Z/image.png" alt=""><figcaption></figcaption></figure>

### New analysis widget – Direct integration of analyses into dashboards and Smart Views

The new **Analysis Widget** enables the display of existing analyses directly in dashboards and Smart Views. It takes over the full configuration of the selected analysis and allows flexible adjustment of the time range without changing the original data.

<figure><img src="https://content.gitbook.com/content/Nyvwhz1kEMXcHf4HLuZ8/blobs/Mtz1o217ky7rY3yUywk3/Analytic%20Widget%20(5).png" alt=""><figcaption></figcaption></figure>

{% content-ref url="/pages/6927cd5de563fc4f60c823400cdc1ba9e98759c9" %}
[Analysis](/collection/english-v14/documentation/widgets/vordefinierte-widgets/analyse.md)
{% endcontent-ref %}

### Job Diagnostics for escalations – Detailed tracking of notifications

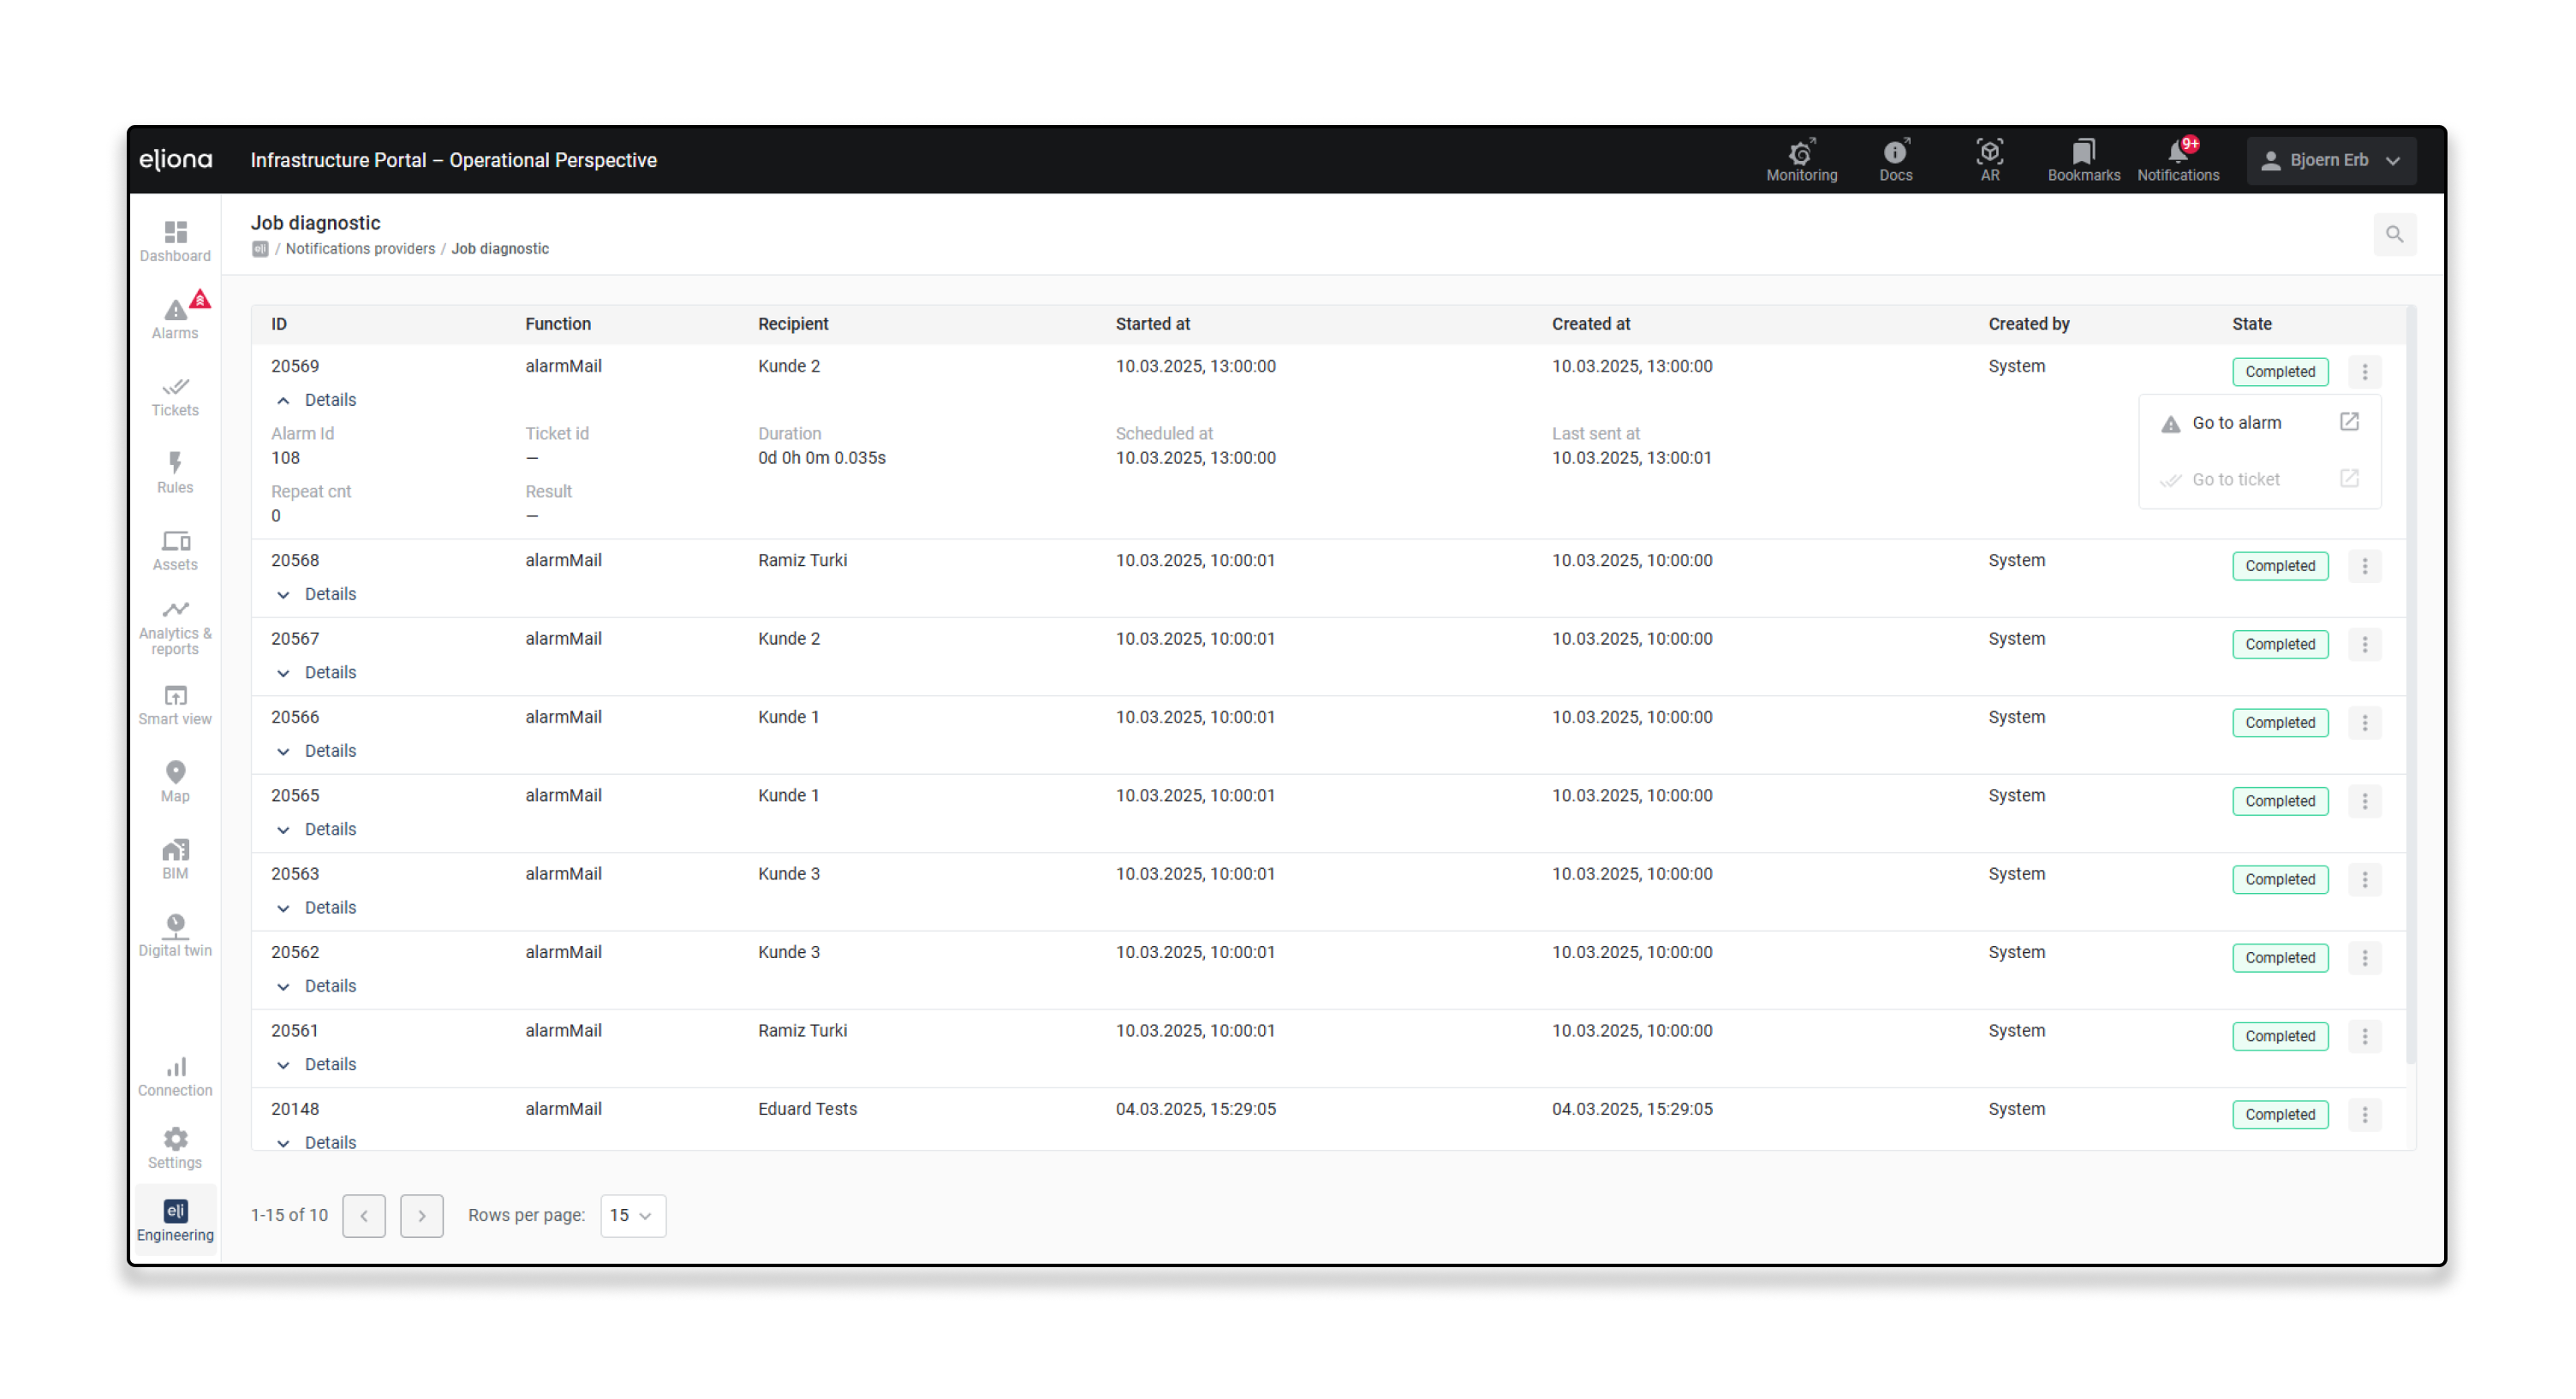
The new **Job Diagnostics**-page enables detailed analysis and monitoring of escalated notifications. It shows which notifications were triggered, via which providers they were escalated, and to which recipients they were sent. It also provides insight into the status, history, and possible delivery problems.

This function helps administrators monitor the sending process, trace escalation chains, and identify problems early. Via the **Job Diagnostics** can navigate directly to the associated alarm or ticket.

<figure><img src="https://content.gitbook.com/content/Nyvwhz1kEMXcHf4HLuZ8/blobs/ZSdhZghvXKXunYAMPDTw/Job%20Dagnostics.png" alt=""><figcaption></figcaption></figure>

{% content-ref url="/pages/c723128bb4b5cb13fae369e3d52e7edd03e37167" %}
[Job diagnostics](/collection/english-v14/documentation/alarme-regeln-und-eskalationen/eskalationen/notification-provider/job-diagnostic.md)
{% endcontent-ref %}

### **Asset characteristics revised – Simplified management with templates**

The configuration of asset characteristics was repetitive and confusing and had some bugs. With the new version, the errors have been fixed and predefined **asset characteristic templates** can now be created and transferred to asset templates with just a few clicks. This makes management easier and significantly reduces manual effort.

<figure><img src="https://content.gitbook.com/content/Nyvwhz1kEMXcHf4HLuZ8/blobs/wHEeaaLPWtqZEjw9mOTd/Offset%20(4).png" alt="" width="563"><figcaption></figcaption></figure>

{% content-ref url="/pages/79b0ab8d11308fa5374c0a6e9a222f0709c58655" %}
[Create a new asset characteristic template](/collection/english-v14/documentation/assets/asset-modellierung-templates-erstellen/ein-neues-asset-charakteristik-template-erstellen.md)
{% endcontent-ref %}

### **Pause or start multiple rules at once**

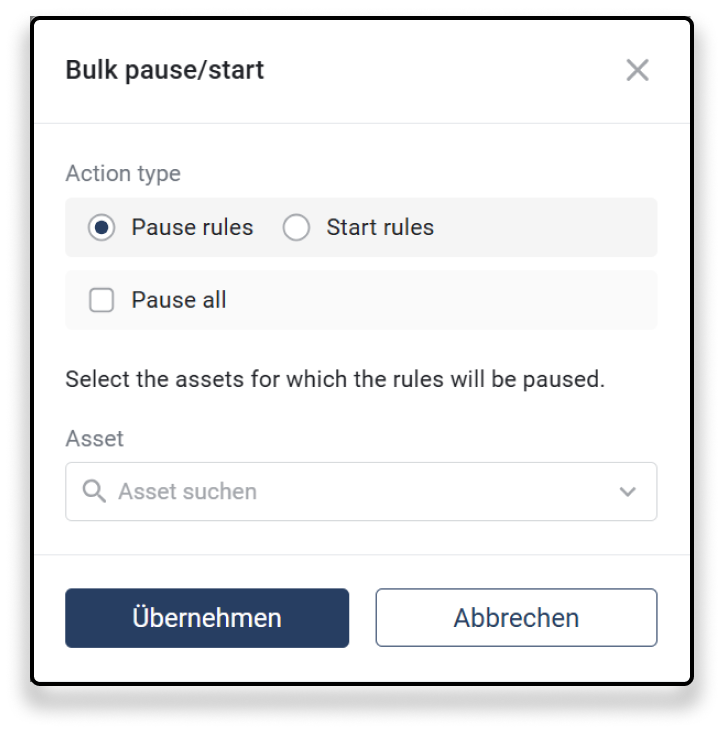
In rule management, multiple rules can now be paused or started at the same time. This makes it easier to control automated processes and enables efficient management of rule chains. [→ Pause or start multiple rules at once](#mehrere-regeln-gleichzeitig-pausieren-oder-starten)

<figure><img src="https://content.gitbook.com/content/Nyvwhz1kEMXcHf4HLuZ8/blobs/NgcmfkSgASbGcXZvNXNz/Bulk%20pausing%20rules.png" alt="" width="362"><figcaption></figcaption></figure>

### **Alarms visible in analysis charts & floor widget**

Alarms can now be visualized directly in analysis charts and displayed in the floor widget. This improves the overview and makes it easier to evaluate alarm events in the context of data analysis and building display. [→ Display alarms in the analysis](/collection/english-v14/documentation/analytics-and-reports/analytics-nutzen.md#alarme-in-der-analysis-anzeigen)

<figure><img src="https://content.gitbook.com/content/Nyvwhz1kEMXcHf4HLuZ8/blobs/oWGOrWnJIc1haSJVUm0K/Alarm%20in%20analytic%20(1).png" alt="" width="563"><figcaption></figcaption></figure>

### **Revision of the booking widget**

In the booking widget, all existing bookings can now be displayed and managed when selecting an asset. This provides a better overview and more efficient management of booking times.

<figure><img src="https://content.gitbook.com/content/Nyvwhz1kEMXcHf4HLuZ8/blobs/74I2krjVbbNGFb5TWtJs/MQTT%20broker%20(3).png" alt="" width="360"><figcaption></figcaption></figure>

{% content-ref url="/pages/a5de30c8da9c29ac8736417ea5a670c5b474cef8" %}
[Booking](/collection/english-v14/documentation/widgets/vordefinierte-widgets/buchung.md)
{% endcontent-ref %}

### **Twig templates in Eliona – Flexible message creation**

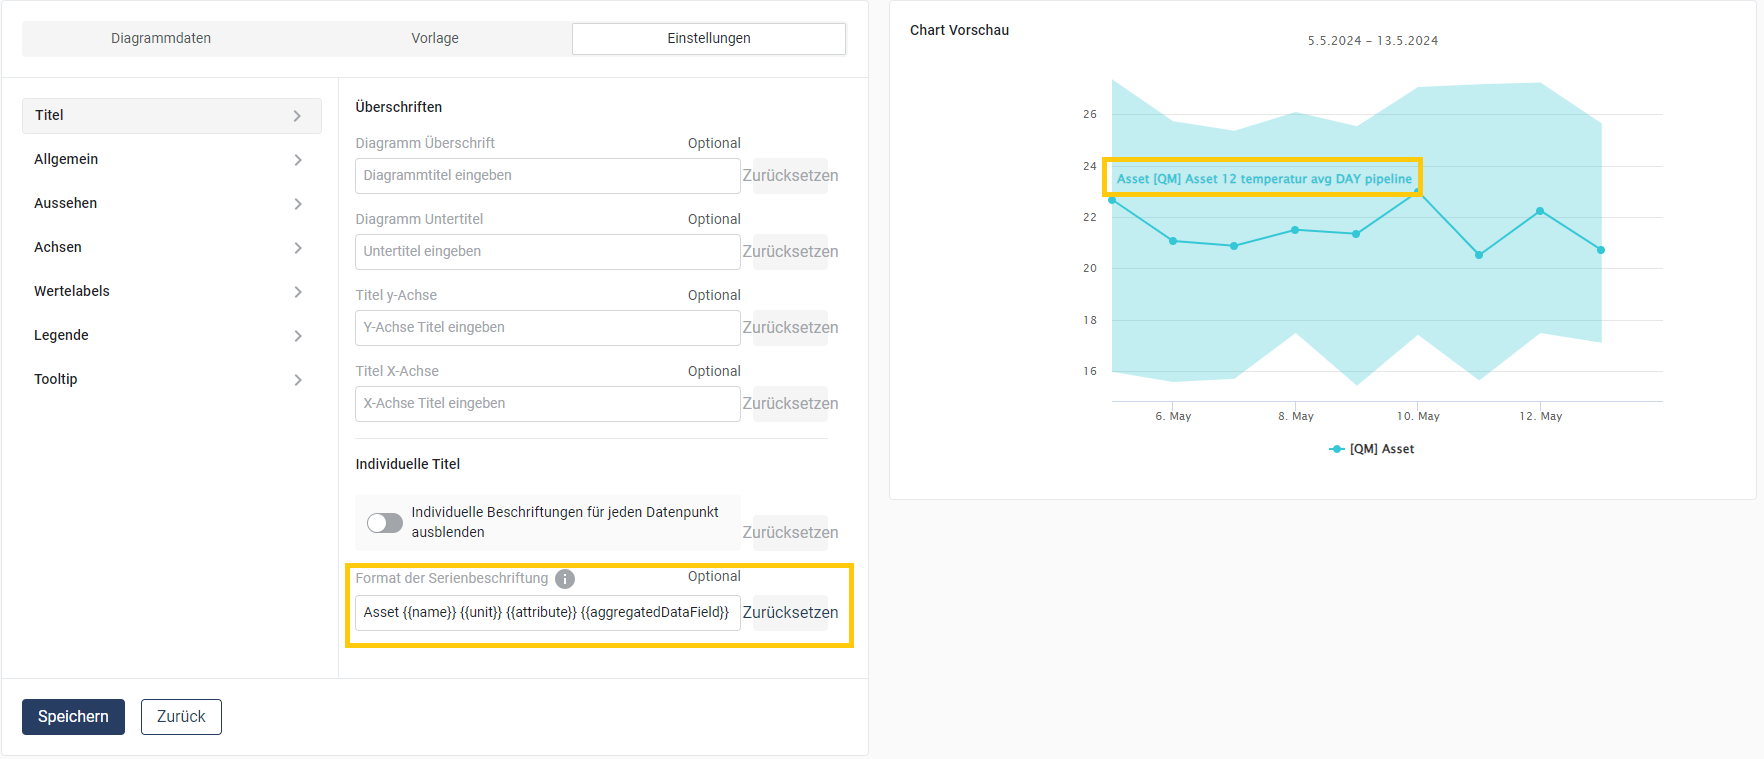
Eliona now supports **Twig.js** for the dynamic creation of message templates. This allows flexible customization of **alarm, ticket, and email templates** with conditional statements, loops, and variables. These can also be used for **yAxis and legend templates** to individually design chart labels.

{% content-ref url="/pages/8894b3c86580a6b6b9cdac807e96502026afb725" %}
[Twig templating in Eliona](/collection/english-v14/academy/twig-templating-in-eliona.md)
{% endcontent-ref %}

### **New trending configuration for attributes**

In the **Asset Template** can now define whether historical data should be stored for attributes. There are two options:

<div align="left"><figure><img src="https://content.gitbook.com/content/Nyvwhz1kEMXcHf4HLuZ8/blobs/ip0O4xTiRy6ukL8aboIc/image.png" alt="" width="563"><figcaption></figcaption></figure></div>

* **On Change:** Values are only stored when they change.
* **Always:** Every incoming value is stored.\
  This setting enables more efficient management of **trend data** and reduces unnecessary storage.

{% content-ref url="/pages/0f2ce7ea5f2d76c610ea31d0b49825a8533707e9" %}
[Create a new template](/collection/english-v14/documentation/assets/asset-modellierung-templates-erstellen/ein-neues-template-erstellen.md)
{% endcontent-ref %}

### **Extended system settings – Improved storage management**

With this version, additional options for managing storage times and data processing have been introduced:

* **Storage time Log & Storage time Trend** - Enables more precise control over the retention period for logs and trend data.
* **Smart Batch Mode** - Optimizes the storage and processing of large amounts of data.
* **Cold Storage & Storage time from** - Automatic archiving of older trend data to reduce storage space.

These new settings improve the efficiency of data management and enable more flexible control over storage strategies.

{% content-ref url="/pages/6c1ae376f41b690d1ba72e137a02dfccb369896c" %}
[System](/collection/english-v14/documentation/einstellungen/system.md)
{% endcontent-ref %}

### **Revision of the Smart Assist menu**

The Smart Assist menu has been revised to simplify configuring user permissions for Smart Views and slider groups. Users can now be assigned to specific views and their order adjusted via drag & drop.

<figure><img src="https://content.gitbook.com/content/Nyvwhz1kEMXcHf4HLuZ8/blobs/ajy040pCaZVk9PhUPeYO/MQTT%20broker%20(4).png" alt="" width="563"><figcaption></figcaption></figure>

{% content-ref url="/pages/39e229bc08a50da974adfd392fec0aa81ab22b1a" %}
[Smart Assist](/collection/english-v14/documentation/smart-views/smart-assist.md)
{% endcontent-ref %}

### **Improvement of the PL/PgSQL script engine**

The script engine now supports the full PL/PgSQL syntax, including the use of variables within a **DO .........** block. This means complex SQL scripts with **DECLARE**- statements and structured workflows can be executed directly in Eliona.

{% content-ref url="/pages/ae3006d00437c0fb64d1c95e25af17ef0e3a554d" %}
[Write PL/PgSQL scripts](/collection/english-v14/documentation/engineering/skript-engine/pl-pgsql-skripte-schreiben.md)
{% endcontent-ref %}

### **New configuration page for the Eliona Broker**

A dedicated **Eliona Broker**-configuration page has been added. Users can there **manage SSL certificates** and **set up user accounts for the broker**, to improve security and access management for MQTT connections.

{% content-ref url="/pages/0d6a954f1cab2dd1664d6e867dc9aa610409fff6" %}
[Eliona Broker](/collection/english-v14/connectivity-as-a-service/gerate-mit-abb-buildingpro-verbinden/gerate-per-mqtt-verbinden/eliona-broker.md)
{% endcontent-ref %}

### **Advanced link options in the Smart Assist menu**

The **Links widget** has been extended and now allows linking links with **Smart Views**. When a link is clicked, a predefined Smart View can be opened directly, making navigation within Eliona even more intuitive.

{% content-ref url="/pages/4d9a7aede8de0c5602693e490fcf48561990bd66" %}
[Links](/collection/english-v14/documentation/widgets/vordefinierte-widgets/links.md)
{% endcontent-ref %}

### **Alarms/rules from external sources now clearly identifiable**

Alarms that originate from **external systems** are now clearly marked in the alarm overview. This makes it immediately apparent whether an alarm was triggered by an **internal rule** or an **external source** . [-> External rules](/collection/english-v14/documentation/alarme-regeln-und-eskalationen/regeln.md#externe-regeln) <img src="https://content.gitbook.com/content/Nyvwhz1kEMXcHf4HLuZ8/blobs/86RtiMxMAEvPe95wiKAu/Frame%201863%201.png" alt="" data-size="line">

### **New filter option for alarm analyses**

The **Alarm statistics** has been extended with a **tag filter** . This allows alarms to be analyzed specifically by certain tags, enabling even more detailed evaluations.

{% content-ref url="/pages/02df6c9b9a00d7231757f9eac9ffd6ccf392e5e5" %}
[Alarm statistics](/collection/english-v14/documentation/alarme-regeln-und-eskalationen/alarme/alarmstatistik.md)
{% endcontent-ref %}

### **Legacy structures cleaned up**

The old legacy linking point has been removed. This eliminates outdated structures and configuration options to make the platform more efficient and future-proof.

***

## **20250313 - Changelog\[v13.2.4 - v13.2.58]**

In these versions, several security vulnerabilities were fixed to improve the stability and security of the system.

## **20241210 - Changelog\[v13.2.3]**

The names of attachments are now displayed in ticket details. We have also fixed the following issues:

* The "Task Priority" column has been removed from the task list.
* Attachments can now be added without a comment.
* UI inconsistencies in ticket templates have been eliminated.
* A bug in the display of relative time in comments was fixed.

## **20241203 - Changelog\[v13.2.2]**

We fixed a bug where the project was not displayed correctly when authentication was done via SSO. With this adjustment, the initial project authentication was moved to the backend to improve performance and security.

## 20241024 - Changelo&#x67;**\[v13.2.1]**

We fixed an issue where the loading time in asset details was noticeably increased when the *Device Simulator App* was not installed. With this fix, the page now loads significantly faster.

## 20241017 - Changelog\[v13.2.0]

We are pleased to introduce you to the latest version of Eliona, which is equipped with numerous new features and optimizations. Among the most important new additions are the **rule chains**, which make it possible to create automated workflows based on events or time triggers, as well as the **custom home page**, which can be customized for each project.

In addition to these highlights, the update offers other exciting improvements such as the **Report table widget**, a revised **Input widget** as well as extended functions for **data entry and editing**, making your daily work in Eliona even more efficient.

[-> Link to full changelog v13.2](https://deploy.eliona.io/helm/changelogs/v13.2.txt)

### Migration from ADFS to SAML SSO

With this version, we recommend migrating the ADFS app to **SAML SSO** to take advantage of modern authentication. Detailed instructions can be found in the [-> SAML SSO documentation](/collection/english-v14/apps/apps/saml-sso.md)[.](/collection/english-v14/apps/apps/saml-sso.md)

### **rule chains**

With this version we introduce **rule chains** as a new feature. Rule chains make it possible to create automated workflows based on events or cyclical triggers. This offers flexible control options for a wide range of applications, from monitoring to process optimization.

<figure><img src="https://content.gitbook.com/content/Nyvwhz1kEMXcHf4HLuZ8/blobs/dMyONJaJLmBtReqhFscW/image%20(7).png" alt=""><figcaption></figcaption></figure>

**Important functions**:

* **Event-based and cyclical triggers**: Define when a rule is triggered - based on a data event or at fixed intervals.
* **Automated actions**: Trigger alarms, create tickets, or send emails based on defined conditions.
* **Integration of conditions and operations**: Use comparisons, delays, and logical operators (AND/OR) to implement complex decision logic.

{% content-ref url="/pages/b8b0d247ff2ff86850ef111fa57a07018d6927e3" %}
[rule chains](/collection/english-v14/documentation/alarme-regeln-und-eskalationen/regelketten.md)
{% endcontent-ref %}

### **Home page**

With this version, you can now define a **custom home page** for each project. This page is displayed first after login or when opening the project and provides a quick overview of important information and widgets. The home page contains a **project overview** with the created elements, direct access to the **project settings**, a **map** with the project location as well as a **weather widget**, which shows the current weather and the forecast for the location.

In addition, you can activate the home page via the project settings and add new **elements to the home page** and configure existing elements to adapt the page to your specific requirements.

<figure><img src="https://content.gitbook.com/content/Nyvwhz1kEMXcHf4HLuZ8/blobs/V54bh8rva5HY2z5gRfXr/Projects%20(1).jpg" alt=""><figcaption></figcaption></figure>

{% content-ref url="/pages/22b6e6df472e42603697cfb862757281cb18a17b" %}
[Home page](/collection/english-v14/documentation/systeme-und-projekte/startseite.md)
{% endcontent-ref %}

### **Report table widget**

With this version, the **Report table widget** was introduced, which makes it possible to display data from different assets in tabular form. You can aggregate data over defined periods and calculate sums or averages. The widget offers a flexible structure that allows columns to be configured individually and content such as text, dates, or numerical data to be displayed. It is particularly well suited for detailed analyses of operating hours, consumption values, or other important metrics.

<figure><img src="https://content.gitbook.com/content/Nyvwhz1kEMXcHf4HLuZ8/blobs/41YRA8jMS8gBRFKtbek6/Report%20Table%20(4).png" alt="" width="563"><figcaption></figcaption></figure>

{% content-ref url="/pages/f499651f68f90c1885c7ab885c8465172561ddf3" %}
[Report table](/collection/english-v14/documentation/widgets/vordefinierte-widgets/reporttabelle.md)
{% endcontent-ref %}

### **Extended data entry and editing functions**

With this version, the data entry and editing functionality has been significantly expanded. You can now easily add new data entries for asset attributes and save them directly in the system. Each entry is provided with a current timestamp to optimize data tracking. In addition, existing historical data can be edited via a simple pencil icon. This makes it easier to correct faulty or inaccurate data.

Another new feature is the **bulk editing of data**. This allows all data records within a specified period to be set to a new value. This is especially helpful when devices have supplied incorrect data during a certain period, as you can now correct them efficiently and quickly.

These functions make data entry and maintenance much easier and faster, resulting in more precise and flexible data management.

{% content-ref url="/pages/a8265b90f2c48124808df5cbebb2da460828fdbc" %}
[Asset data](/collection/english-v14/documentation/assets/asset-daten.md)
{% endcontent-ref %}

### **History function for calculations**

With this version, the **history**-function has been introduced, which makes it possible to access historical values of attributes. You can now use previous values of an attribute in calculations to analyze trends or track changes over time. The syntax allows specific past values to be retrieved by using a negative value for the parameter `back_step` , e.g. `-1` for the last value or `-2` for the second-to-last.

This new function offers a more flexible and detailed analysis of data over time and makes it easier to create complex calculation chains.

{% content-ref url="/pages/4d26cefc5e906124d2bc600bec44dba25af66506" %}
[Calculate values: The calculator](/collection/english-v14/documentation/weitere-funktionen/attribut-funktionen/werte-berechnen-der-calculator.md)
{% endcontent-ref %}

### **Redesign of the input widget**

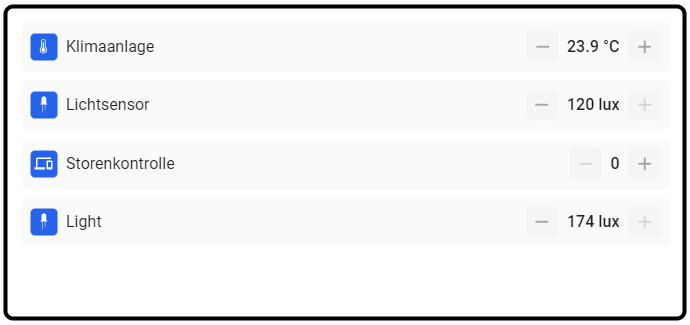
The **Input widget** has been completely redesigned and now offers a significantly more modern design as well as improved usability. The new version is visually more appealing and considerably more intuitive to use, making interaction and data entry much easier.

In addition, two new functions have been introduced:

* **Enable icons**: The icons of the associated attributes can now be displayed directly as well, improving clarity.
* **Split vertically**: This option allows the input fields to be arranged not only one below the other, but also side by side, resulting in a more flexible and compact display.

These improvements offer more flexibility and make working with the input widget more efficient and user-friendly.

<div align="left"><figure><img src="https://content.gitbook.com/content/Nyvwhz1kEMXcHf4HLuZ8/blobs/SZNGOi9mxb5oCu71nwaf/image.png" alt="" width="518"><figcaption></figcaption></figure></div>

{% content-ref url="/pages/e512c07ca4fe646f348dcc6b01c1151733b8c0f4" %}
[Inputs & switches](/collection/english-v14/documentation/widgets/benutzerdefinierte-widgets/module/eingaben-and-schalter.md)
{% endcontent-ref %}

### Revision of the floor widget

The **Floor widget** has been fundamentally revised and now offers significantly improved functions that make it more efficient and user-friendly. With the new button **“Add current polygons/POIs”** all objects placed on a floor, such as polygons or points of interest, can be transferred into the widget with a single click. This eliminates the need to add each object manually and thus saves valuable time during setup.

<div align="left"><figure><img src="https://content.gitbook.com/content/Nyvwhz1kEMXcHf4HLuZ8/blobs/cRE7Fpqc4YxnOvN2V6gw/image.png" alt="" width="267"><figcaption></figcaption></figure></div>

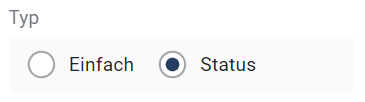
In addition, the option to switch between two display modes has been introduced: the **“Simple”** and the **“Status” view**. The simple view provides a clear overview of all placed objects, while the status view makes it possible to keep an eye on the current status of these objects. This is especially useful in situations where continuous monitoring is required.

<div align="left"><figure><img src="https://content.gitbook.com/content/Nyvwhz1kEMXcHf4HLuZ8/blobs/j77RUzAGHt0jCyC8aitS/image.png" alt="" width="274"><figcaption></figcaption></figure></div>

With these new functions, managing floor objects is significantly simplified, which both increases efficiency and improves flexibility in using the widget.

{% content-ref url="/pages/3c77339c39eab3b645622388787453af76e575bf" %}
[Floor](/collection/english-v14/documentation/widgets/vordefinierte-widgets/stockwerk.md)
{% endcontent-ref %}

### **Onboarding**

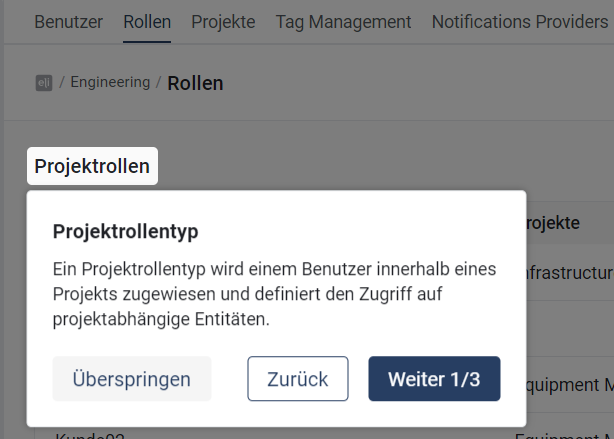
With this version, an **onboarding feature** has been introduced in Eliona. This new feature provides an interactive guide that gives users an introduction to the functions of various Eliona pages when they access them for the first time.

<div align="left"><figure><img src="https://content.gitbook.com/content/Nyvwhz1kEMXcHf4HLuZ8/blobs/NjfWfz6suwyviCnbkk9Q/image.png" alt="" width="307"><figcaption></figcaption></figure></div>

{% content-ref url="/pages/074d3c968e6c7d41a9ef76434c0e4355565eb37f" %}
[Welcome to ABB BuildingPro: An interactive introduction](/collection/english-v14/getting-started/willkommen-in-abb-buildingpro-eine-interaktive-einfuhrung.md)
{% endcontent-ref %}

### **Data retention period and audit log**

With this version, it is now possible to set the **retention period** for data to up to **60 months** . On request, the retention period can even be set to **unlimited** . In addition, an **audit log limit** has been introduced to manage access to log data.

{% content-ref url="/pages/6c1ae376f41b690d1ba72e137a02dfccb369896c" %}
[System](/collection/english-v14/documentation/einstellungen/system.md)
{% endcontent-ref %}

### **GAI in asset selectors**

From now on, the **GAI (Global Asset ID)** is displayed in all asset selectors. It is also possible to search for assets specifically by GAI, which makes identifying and selecting assets much easier.

## 20240920 - Changelog \[v13.1.6]

In this hotfix, we fixed a bug that caused users without permission to **users in other lists** not to be able to select the default ticket recipient when creating a ticket.

## 20240905 - Changelog \[v13.1.5]

In this update, we made several improvements and bug fixes in the areas of **navigation**, **Digital Twin** and **tickets** :

### **General**

The **Default navigation path** is now **role-dependent**. If a role does not have access to dashboards, the dashboard is no longer automatically loaded as the default view. Instead, the **next available sidebar path** to which the role has access is selected.

### **Digital Twin**

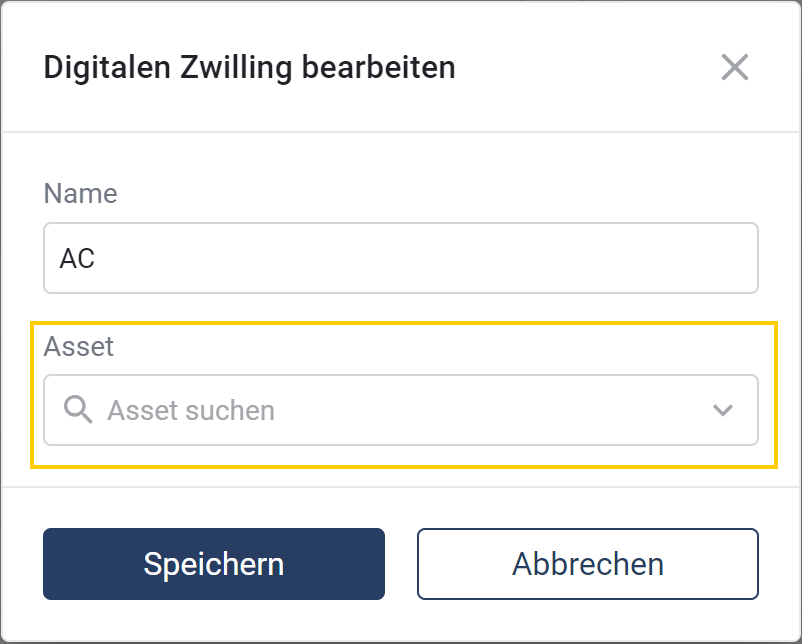
It is now possible to change the **asset after creating the digital twin** . To do this, next to the digital twin click on <img src="https://content.gitbook.com/content/Nyvwhz1kEMXcHf4HLuZ8/blobs/ZzNKRz2aMlE78rYHmaD8/image.png" alt="" data-size="line"> and then on<img src="https://content.gitbook.com/content/Nyvwhz1kEMXcHf4HLuZ8/blobs/WKYAHn7jnEdmRUJ89pkp/image.png" alt="" data-size="line"> Alternatively, the corresponding window can be opened directly in the digital twin itself via <img src="https://content.gitbook.com/content/Nyvwhz1kEMXcHf4HLuZ8/blobs/lossGqKiQtZRtx0pC48E/image.png" alt="" data-size="line"> In this window, the desired asset can then be specified.
<div align="center"><figure><img src="https://content.gitbook.com/content/Nyvwhz1kEMXcHf4HLuZ8/blobs/LwbHm5qjOpKNiq3Ih5z8/Screenshot%202024-09-05%20133033.png" alt="" width="375"><figcaption></figcaption></figure></div>

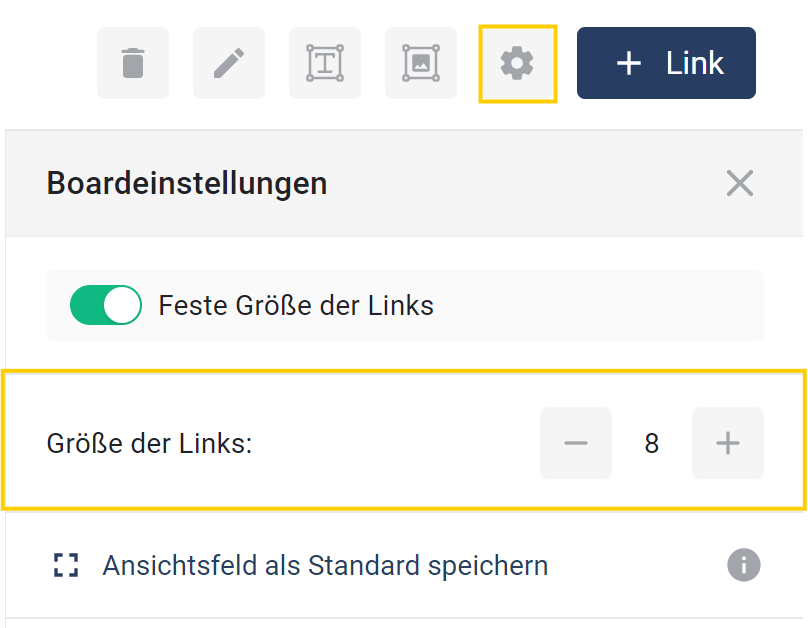
The **Size of links** can now be adjusted.\nFor this, in the digital twin under the **gear icon** <img src="https://content.gitbook.com/content/Nyvwhz1kEMXcHf4HLuZ8/blobs/JWUDVkfnwrQMN2EJuZPJ/image.png" alt="" data-size="line"> there is a new option **"Link size"**, in which the relative size of all links can be set.
<div align="center"><figure><img src="https://content.gitbook.com/content/Nyvwhz1kEMXcHf4HLuZ8/blobs/FSW4YSsUUgU6szJ4HLXY/Screenshot%202024-09-05%20134225.png" alt="" width="375"><figcaption></figcaption></figure></div>

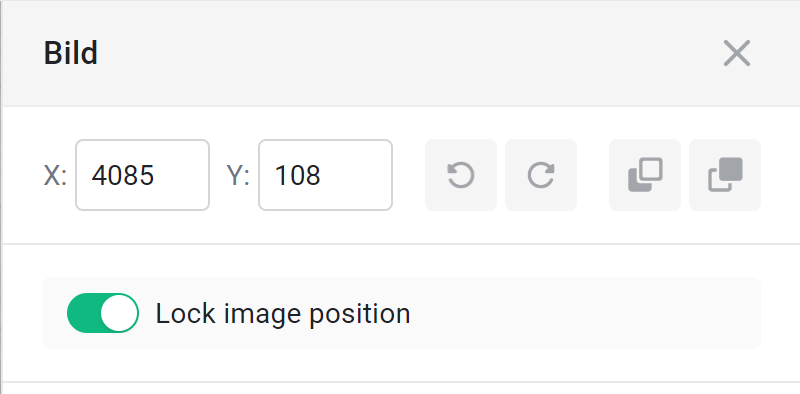
The **Image function** in the digital twin has been expanded with some useful options. From now on, images can be conveniently dragged from your folder to the desired location in the digital twin via **drag-and-drop** . Once an image is selected, it is now possible to **rotate it** <img src="https://content.gitbook.com/content/Nyvwhz1kEMXcHf4HLuZ8/blobs/psKi98SJ66zp4y56tM4A/image.png" alt="" data-size="line"><img src="https://content.gitbook.com/content/Nyvwhz1kEMXcHf4HLuZ8/blobs/pLJbfuLT1ZVwO9YVA6tN/image.png" alt="" data-size="line"> or change the **arrangement** of the images by moving the image **in front of** <img src="https://content.gitbook.com/content/Nyvwhz1kEMXcHf4HLuZ8/blobs/zznxnc07qpQqP9duTfby/image.png" alt="" data-size="line"> or **behind** <img src="https://content.gitbook.com/content/Nyvwhz1kEMXcHf4HLuZ8/blobs/t2vVAN8zbsRPYnHZo0Ex/image.png" alt="" data-size="line"> other images.

A particularly useful new feature is the option <img src="https://content.gitbook.com/content/Nyvwhz1kEMXcHf4HLuZ8/blobs/2Ro3HT2xHrSWQhhuAUzr/image.png" alt="" data-size="line">, with which the position of an image can be fixed. When this option is activated, the image can no longer be moved accidentally – instead, only the view is moved when you drag the image. This keeps the position of the image unchanged and unwanted shifts are a thing of the past.


<figure><img src="https://content.gitbook.com/content/Nyvwhz1kEMXcHf4HLuZ8/blobs/9vwdCWg7AkTkIFTUsXHW/image.png" alt="" width="375"><figcaption></figcaption></figure>

It is now also possible to **selected elements** with the **Del-** or **Del key** delete. In addition, **selected elements** by pressing the **Esc key** they can be deselected again.

### **tickets**

For the **tickets** some **display issues** have been fixed that previously led to visual errors. Under certain circumstances it was not possible to **Tasks** create, which has now been fixed. Tasks can now be created again without any problems.

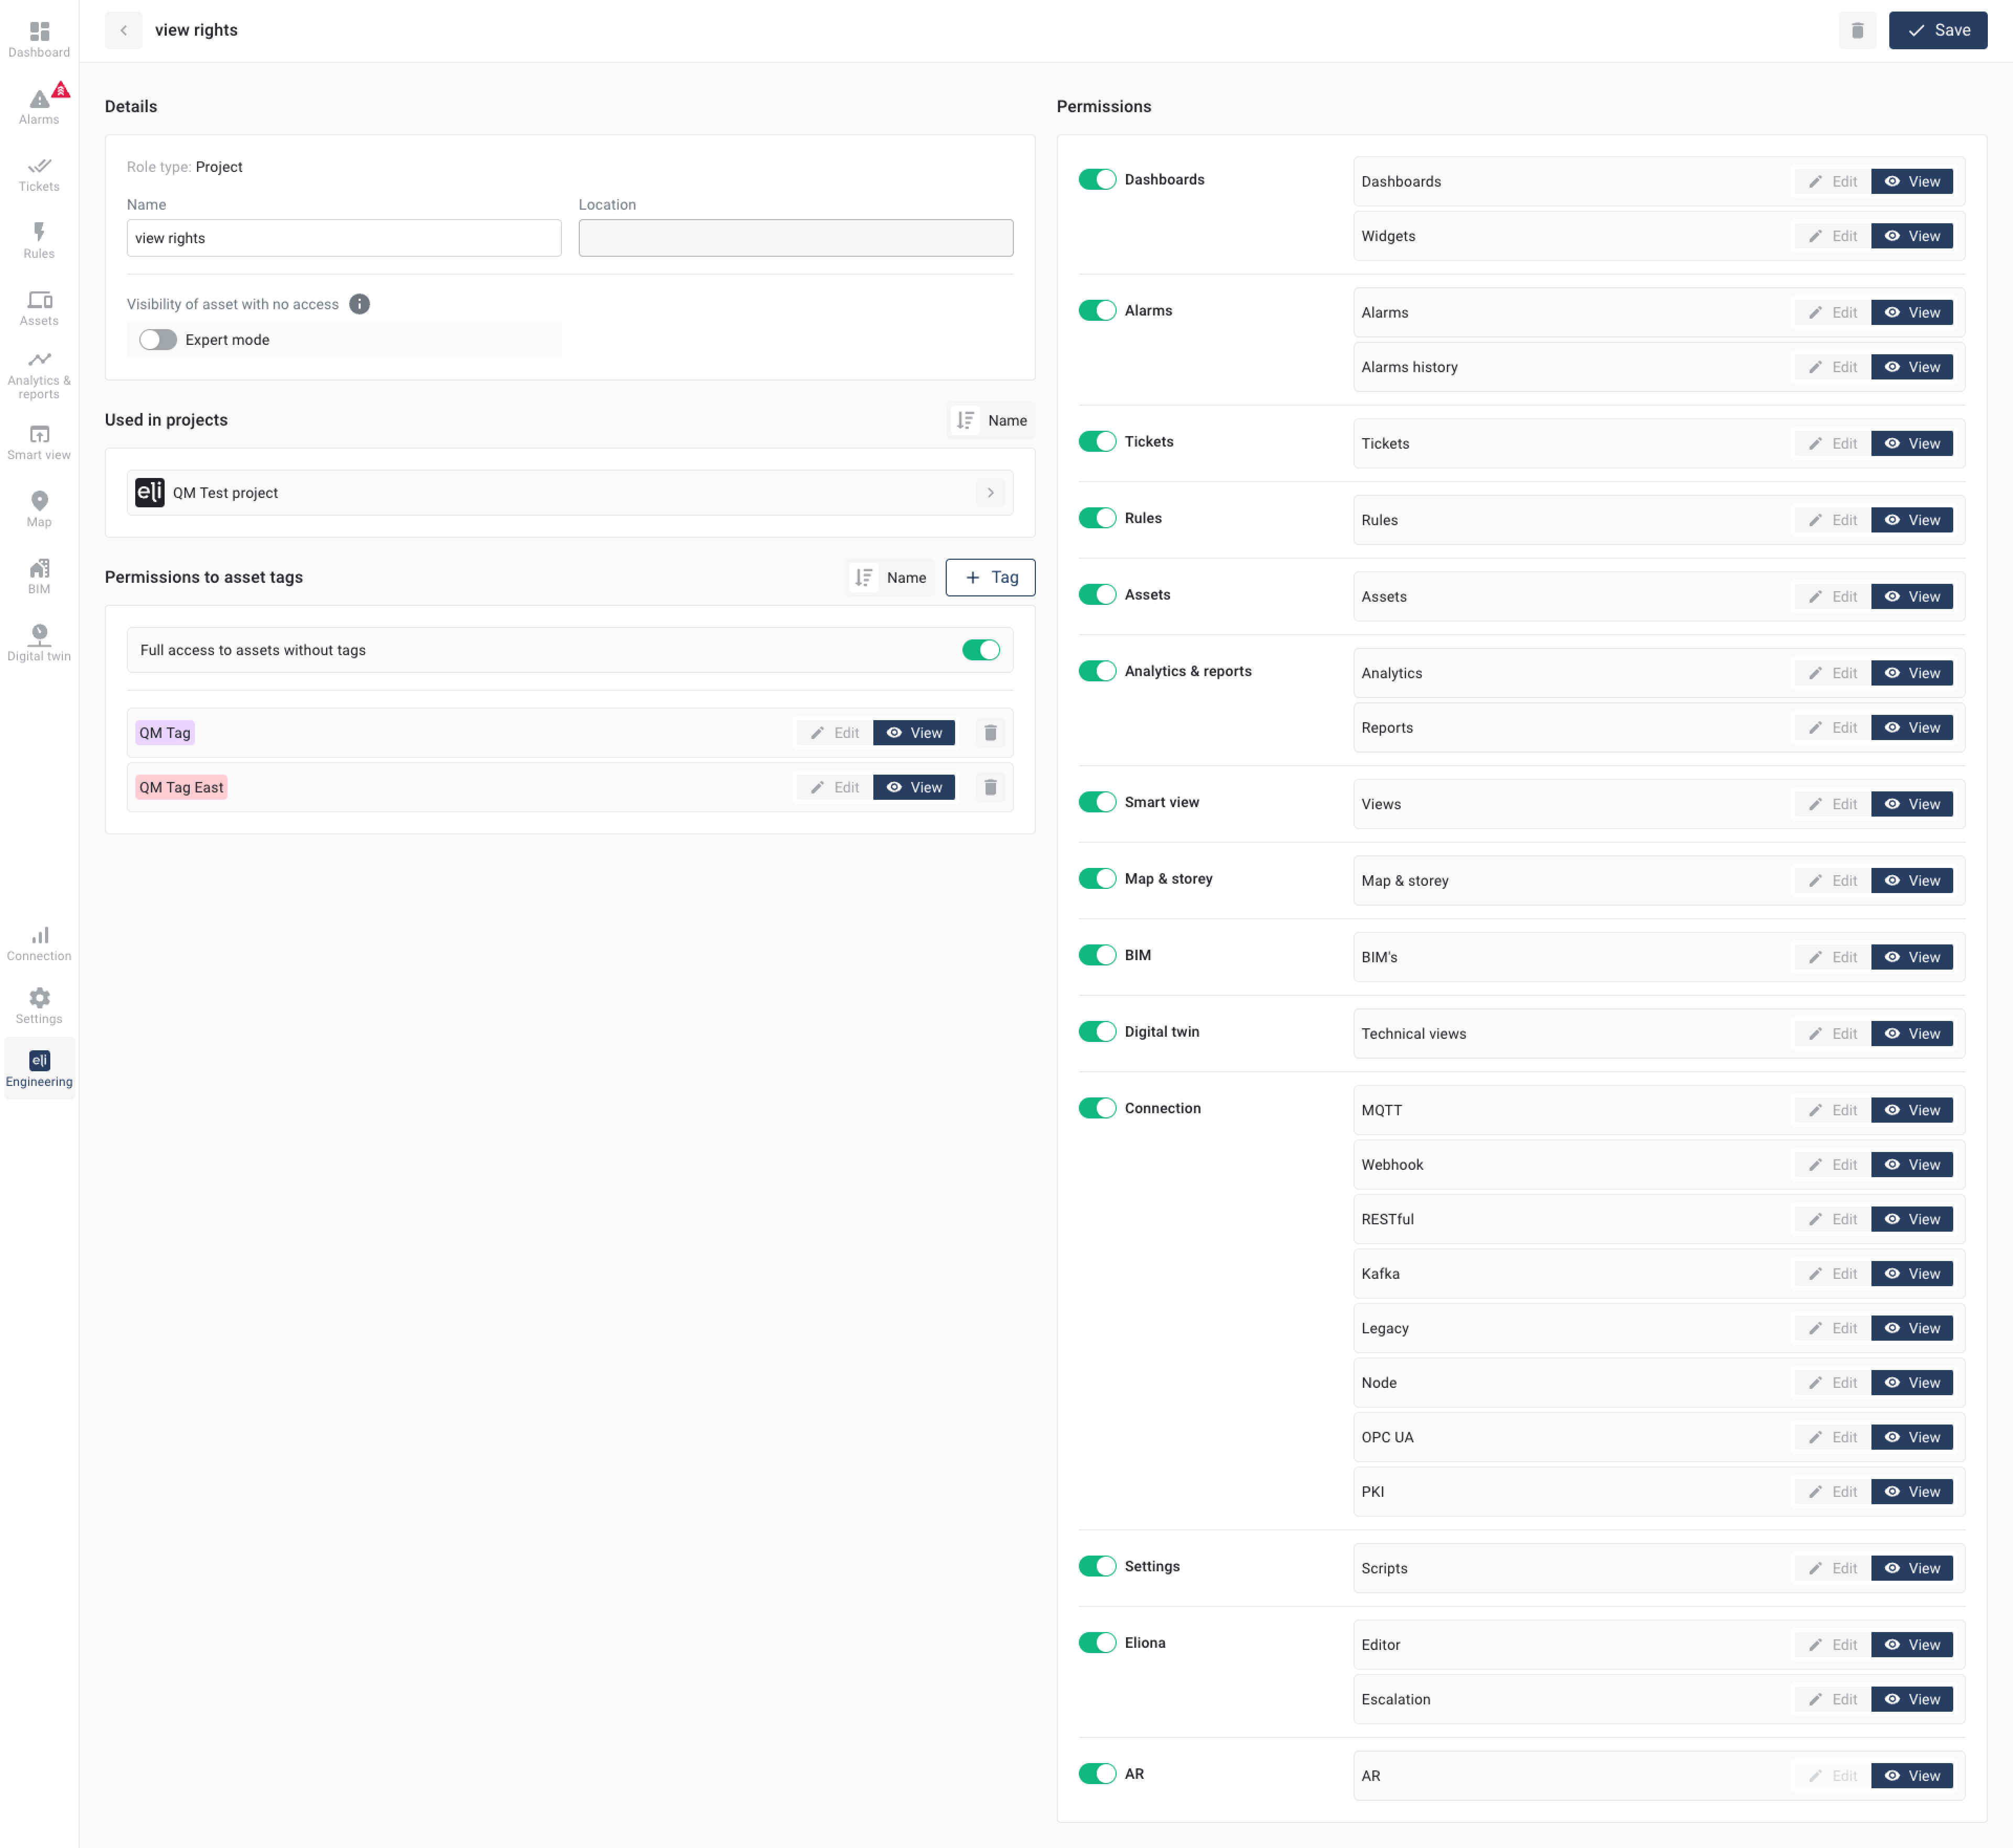
In the **permissions** for tickets, there are now additional **settings** in the **Project roles**. The permissions for the **ticket list view** and the **ticket details** are now managed separately. For the **ticket details** and **Tasks** there are now options to distinguish between **manage**, **write** and **read** in order to enable more differentiated permission assignment.<br>

<figure><img src="https://content.gitbook.com/content/Nyvwhz1kEMXcHf4HLuZ8/blobs/7dtJvLnPCWFTNIdLpJWQ/image.png" alt=""><figcaption></figcaption></figure>

## 20240808 - Changelog \[v13.1.4]

In this hotfix, we fixed a bug that caused the tooltip in the dashboard to be displayed in the wrong place when multiple trends were present.

## 20240801 - Changelog \[v13.1.3]

In this hotfix, we fixed performance issues that occurred with large datasets in dashboards, analytics, and smart views. These optimizations ensure that large datasets no longer cause problems.

## 20240719 - Changelog \[v13.1.2]

In this hotfix, we fixed a bug that prevented asset characteristics from being added in the asset template.

***

## 20240718 - Changelog \[v13.1.1]

In this hotfix, we resolved several issues:

1. The transition from the old Digital Twin to the new Digital Twin design no longer causes any difficulties.
2. When clicking on a link, the data overview is now displayed by default instead of the configuration view.
3. Old images are now scaled correctly.
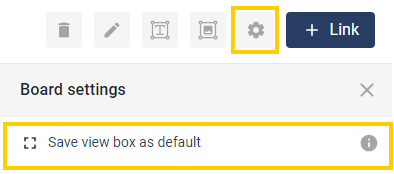
4. It is now possible to set the view when opening the Digital Twin by clicking the gear icon and selecting "Save view area as default".

<figure><img src="https://content.gitbook.com/content/Nyvwhz1kEMXcHf4HLuZ8/blobs/vkeTshCauwahfnMxdhmz/save_as_default.png" alt=""><figcaption></figcaption></figure>

In addition, we fixed a bug that displayed the wrong placeholder in the input widget.

***

## 20240710 - Changelog \[v13.1.0]

We are pleased to present the latest update of Eliona, version 13.1.0. This version brings a variety of new features and improvements that further optimize your user experience and make your workflows even more efficient. From the new wayfinding feature, which enables flexible navigation through your facility, to the ability to individually customize email subject lines for escalated emails, to comprehensive improvements in the Digital Twin - Eliona v13.1.0 offers numerous enhancements and improvements specifically tailored to your needs. Read on to learn more about the exciting new features this version brings.

### Full changelog

<details>

<summary>Changelog v13.1</summary>

\##\[v13.1.0] - 10.07.24

**### Added**

Dashboard/Smart view -> SBB widget ([✓ \[Discovery\] Create react app in Eliona](https://app.asana.com/0/1200252355215223/1206904986524061/f))\[@sti]

Dashboard/Smart view -> Alarm widget -> Detailed Alarm List ([✓ 🔵 Detailed alarm list in Widgets](https://app.asana.com/0/1200252355215223/1206055204586537/f))\[@sti]

Dashboard/Smart view -> Heatmap Tracking widget -> ([✓ \[FE\] Heatmap Tracking Element](https://app.asana.com/0/1200252355215223/1206713603771616/f))\[@nl]

Asset Details Form -> Associated ID -> new input style for IDs (<https://app.asana.com/0/1200252355215223/1207169605955829/f>) \[@sti]

Sidebar -> Alarm Icon -> now showing different color depending on highest prio ([✓ \[FE\] - Alarm icon menu item](https://app.asana.com/0/1200252355215223/1206938387815576/f)) \[@sti]

**Wayfinding -> Users can select starting building & starting point (**[**✓ \[FE\] Link to Wayfinding View** ](https://app.asana.com/0/1200252355215223/1207370026137796/f)**)\[@nl]**

Smartview -> add smartassist /sa link ([✓ FE - Link to "/sa", real Smart Assist](https://app.asana.com/0/portfolio/1199554442331824/workload/1207160155225062))\[@rtu]

**Engineering -> Notification Provider -> Added subject field (**[**✓ 👁️ \[FE\] OMSswiss -> escalation subject message**](https://app.asana.com/0/1200252355215223/1207355385048172/f) **)\[@jp]**

**Asset Details -> asset categories (SB-\[ADC]) \[@jp]**

**Asset Details -> added asset rating (asset\_rating) \[@lw]**

**### Changed**

Map -> Clicking on a list item no longer opens the asset page. Instead, it highlights the position of the asset ([✓ \[FE\] Polygon highlighting when selected](https://app.asana.com/0/1200252355215223/1207370336841290/f))\[@nl]

Map -> Hides asset info drawer when search is opened and vice versa ([✓ 🔵 V12 - Storey Search](https://app.asana.com/0/1182566401713025/1207343569253346/f))\[@nl]

General -> Disable selecting an attribute for disabled asset type attributes ([✓ \[FE/BE\] - Disabled asset type attributes should be disabled in dashboard/analytics selects... ](https://app.asana.com/0/portfolio/1199554442331824/workload/1207370336841293))\[@rtu]

Connection -> OPCUA set enable to default true in subscriptions \[@lwa]

Weather widget -> Updated design, color scheme support \[@nl] ([✓ \[FE, REDESIGN\] Weather Widget](https://app.asana.com/0/1200252355215223/1207371310735759/f))

Login -> encrypt pw to prevent clear text in request ([✓ \[FE\] - Blowfish algo for the frontend ](https://app.asana.com/0/portfolio/1199554442331824/workload/1207370934758896))\[@rtu]

**Tickets -> enhanced tickets with templates and default user (digital\_ticketing) \[@lw]**

**Digital Twin -> reworked DT to use Infinity board & general design improvements (dt\_update) \[@lw]**

**### Fixed**

Engineering -> Asset modeling Open asset type details after creation (BR-2804) \[@rtu]

Map -> Storey config -> Added scrollbar to the form on small screens ([✓ Storey configuration not scrollable](https://app.asana.com/0/1187198351569417/1207419472179128/f))\[@nl]

Widgets -> Alarm Widget -> added missing tags mode select to element ([✓ Alarm Widget filter by tagMode (and/or)](https://app.asana.com/0/portfolio/1199554442331824/workload/1207416263476113))\[@rtu]

Settings -> Audit Trail -> added missing connection and app audit trail event types [✓ Audit Trail event types missing in FE](https://app.asana.com/0/1187198351569417/1207470514484119))\[@rtu]

Asset -> Details -> fix removing geographical and functional references ([✓ Setting parent asset to empty](https://app.asana.com/0/portfolio/1199554442331824/workload/1207479477973053))\[@rtu]

Map -> fixed counting of alarms on the displayed area ([✓ UBS - Alarm summary counts pois hidden behind the sidebar](https://app.asana.com/0/1187198351569417/1207415320822560/f))\[@nl]

Analytics & Reports -> fix chart series color conflicts when using multiple charts ([✓ V13 - Analytics Color](https://app.asana.com/0/portfolio/1199554442331824/workload/1207571717345415))\[@rtu]

Analytics & Reports -> save analytics charts in "last unsaved analytics" (BR-2865) \[@rtu]

Widgets -> Time widget -> the widget displays outdated time ([✓ Time Widget not working (time shows always time when smart view was openend)](https://app.asana.com/0/1187198351569417/1207548759269773/f))\[@nl]

Smartview -> Iframe -> added minHeight config field ([✓ Smart View Iframe in Phone view too small/no way to put in pixel hight](https://app.asana.com/0/portfolio/1199554442331824/workload/1207666291694433))\[@rtu]

Asset -> Asset Links -> remove capitalizes lowecase text transformation ([✓ \[Assets\] Word "Niagara" in the link name starts with a lowercase letter](https://app.asana.com/0/portfolio/1199554442331824/workload/1207573651627594))\[@rtu]

</details>

### **Wayfinding start from the building**

With the new wayfinding function, users can now start directly from the **building view** or from a **specific building**. This improvement makes it possible to flexibly choose the starting point for route descriptions and offers user-friendly and intuitive navigation through your facility.

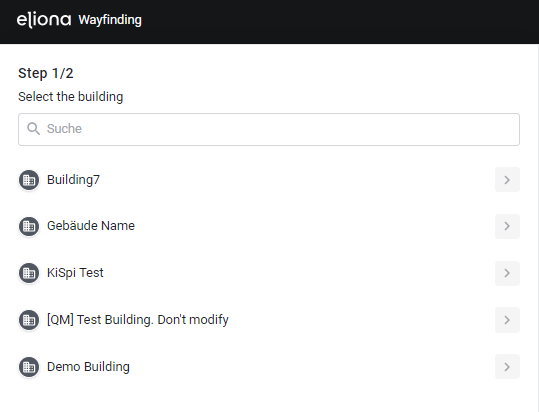
#### Building view

To get to the building view, simply append your URL with **/wayfinding** in, for example: "<https://your.url.i&#x6F;**/wayfinding>\*\*". You can use this URL in your application to direct the user to the **building view** . In this view, the user can select or search for a building from which they want to start.

<figure><img src="https://content.gitbook.com/content/Nyvwhz1kEMXcHf4HLuZ8/blobs/OHZEK8Eqhob4xXKJZrE5/image.png" alt=""><figcaption></figcaption></figure>

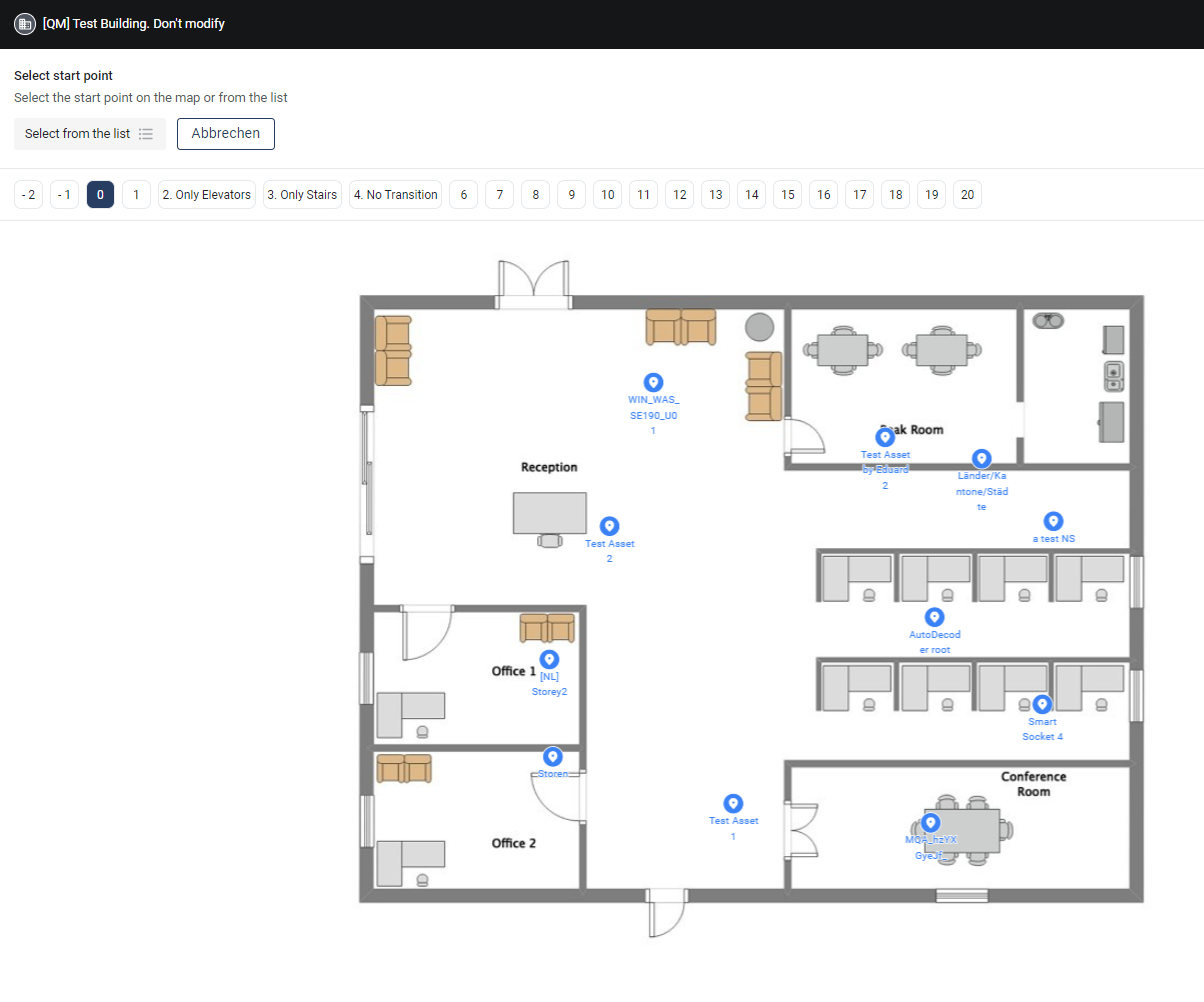
#### Floor view

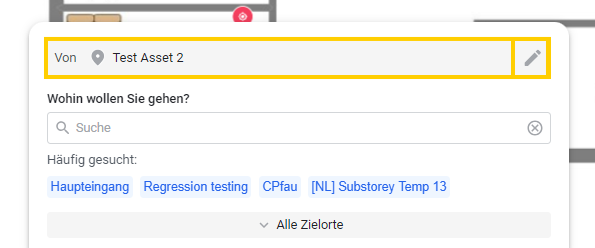
To let a user start directly in a specific building, use the URL **/wayfinding?buildingId={id}**, where {id} is the **building ID** Then the user will be redirected to the floor view. In this view, they can select their **starting point within the floors** or search via the expandable search bar.

<figure><img src="https://content.gitbook.com/content/Nyvwhz1kEMXcHf4HLuZ8/blobs/YqqLiRzv584vW3aDyLXa/image.png" alt=""><figcaption></figcaption></figure>

Once a starting point has been selected, everything works as usual, with the only difference being that the **starting point can be changed at any time**.

<figure><img src="https://content.gitbook.com/content/Nyvwhz1kEMXcHf4HLuZ8/blobs/rWMG98tC2jVyu8jLMdTF/StartWayfinding.png" alt=""><figcaption></figcaption></figure>

### Customize email subject for escalated emails

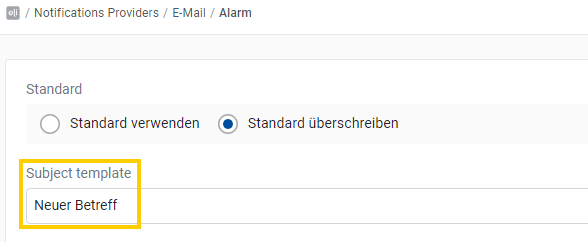
We are pleased to present a new feature: from now on, it is possible to customize the subject line of escalated emails individually. You can do this easily in just a few steps:

1. **Navigate to Engineering > Notifications Providers > E-mail.**
2. **Edit the desired email template.**
3. **Select the "Overwrite default" option.**
4. **Enter the desired subject in the "Subject template" field.**

<figure><img src="https://content.gitbook.com/content/Nyvwhz1kEMXcHf4HLuZ8/blobs/ASWYIh8ubyX0utEEt6Af/Betreff.png" alt=""><figcaption></figcaption></figure>

With this new feature, you can ensure that the subject lines of your escalated emails exactly meet your requirements and make your communication even more efficient.

### What's new in the Digital Twin

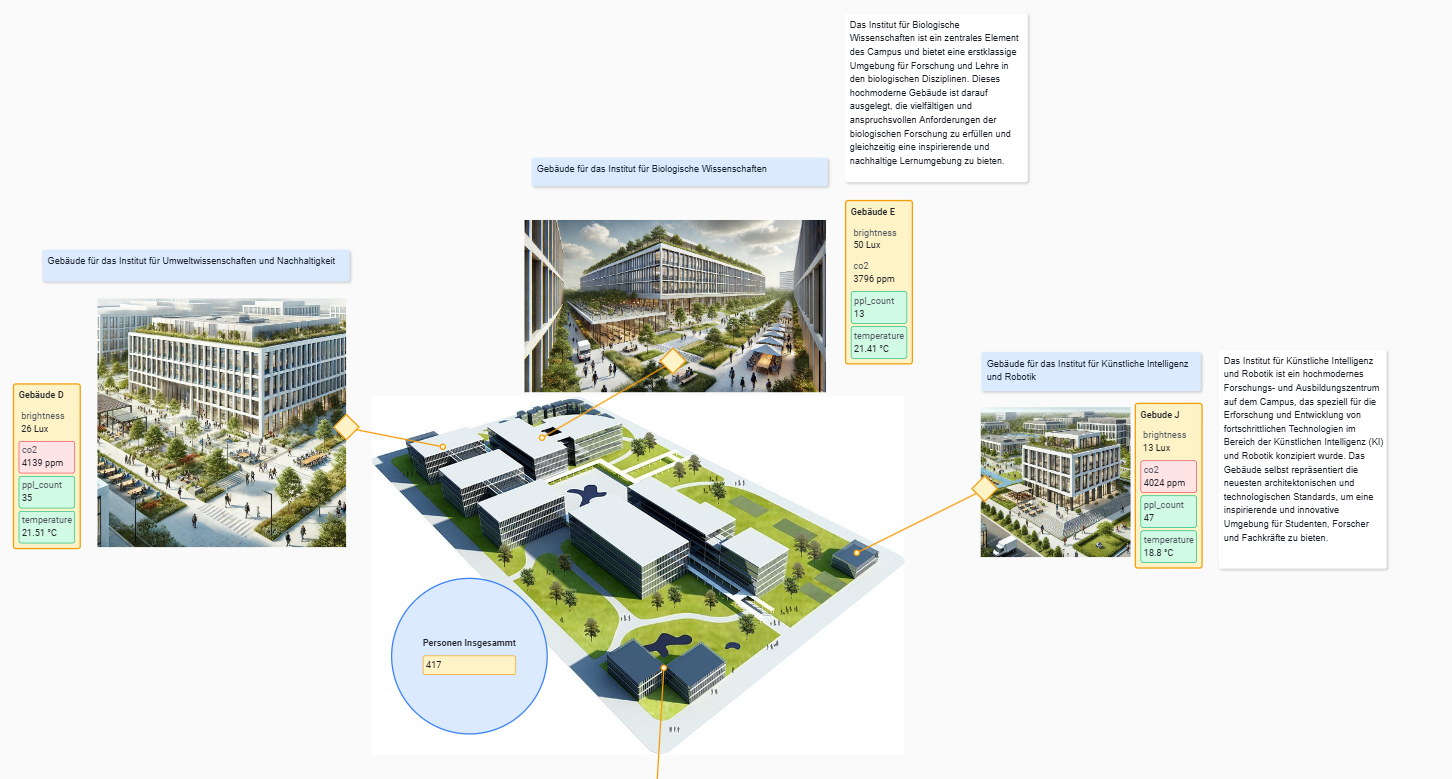
The Digital Twin has been extensively revised and now offers a wide range of new functions and improvements. It is now possible to **add unlimited images** . In addition, **text fields** can be added in any colors and scaled freely. The links also now offer some cool new features.

<figure><img src="https://content.gitbook.com/content/Nyvwhz1kEMXcHf4HLuZ8/blobs/UwZCR6IB6rzar9UApn9j/image.png" alt=""><figcaption></figcaption></figure>

<figure><img src="https://content.gitbook.com/content/Nyvwhz1kEMXcHf4HLuZ8/blobs/4nxsuMKTfs3tDwFEKcX2/image.png" alt=""><figcaption></figcaption></figure>

#### Linking

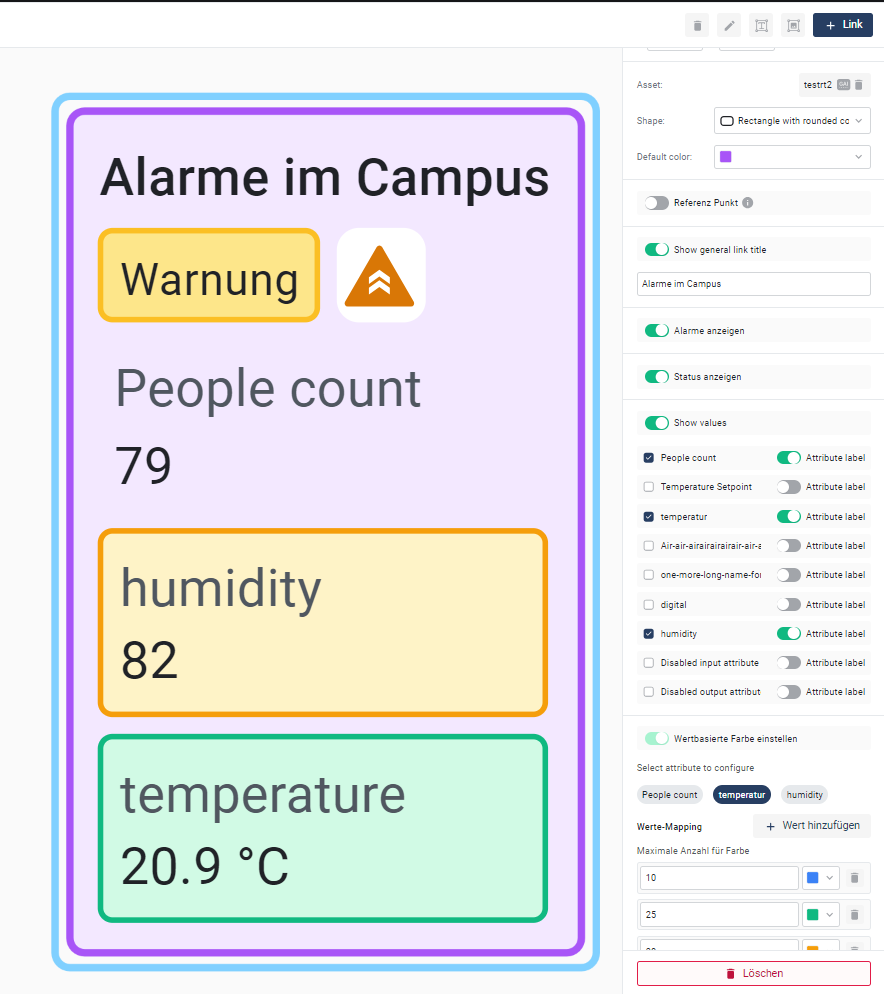
The links now have several options. The **shape** can be selected, a reference point defined, and a **title added** . In addition, the **values of all attributes** can be displayed in a link. The **color of the link can be adjusted depending on the value** of an attribute. Simply click the gray-highlighted attribute and add colors in value mapping.

<figure><img src="https://content.gitbook.com/content/Nyvwhz1kEMXcHf4HLuZ8/blobs/DKltIWMz7vQEAx3pxZy3/image.png" alt=""><figcaption></figcaption></figure>

These new functions give you more flexibility and enable a more precise and appealing presentation of your Digital Twin.

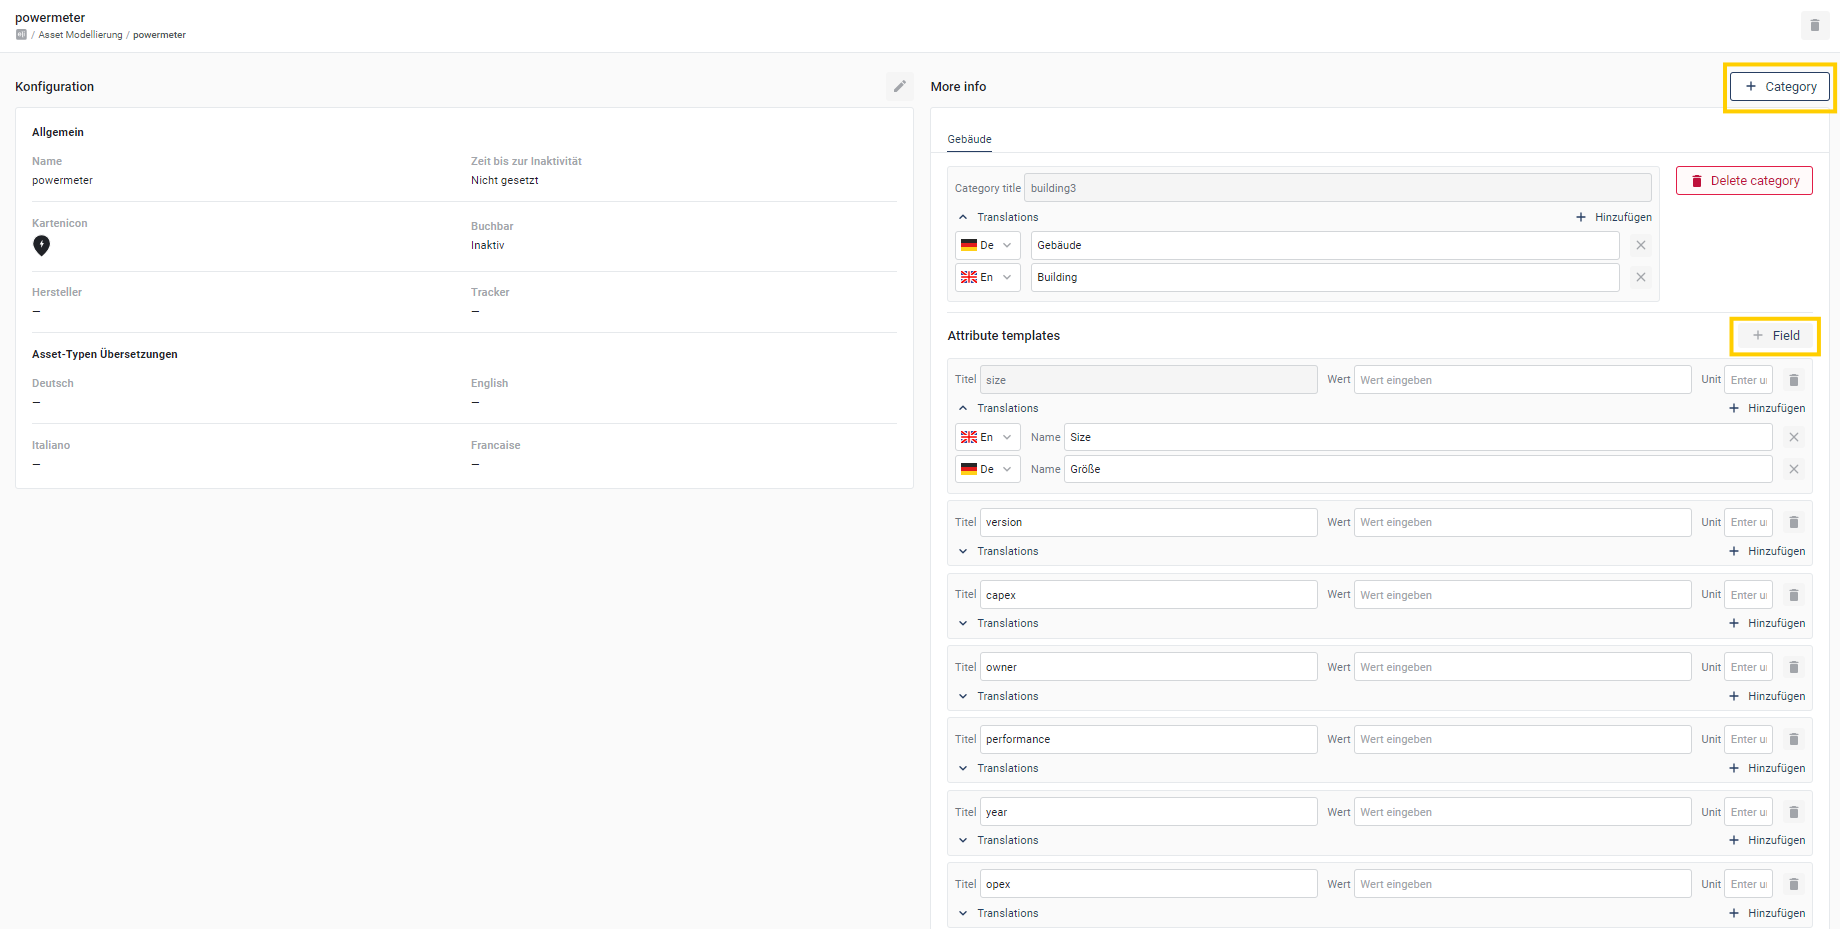
### **Asset characteristics**

It is now possible to add detailed information to an asset.

When editing an asset type, you now have a new window available in which comprehensive information can be added for each asset. This information can be divided into different **categories** , and for each category **multiple fields with name, value, and unit** can be created. Of course, **translations** for the added information can also be stored.

<figure><img src="https://content.gitbook.com/content/Nyvwhz1kEMXcHf4HLuZ8/blobs/E5kSZhzGzFXiUsLCtl0m/kategorien%201.png" alt=""><figcaption></figcaption></figure>

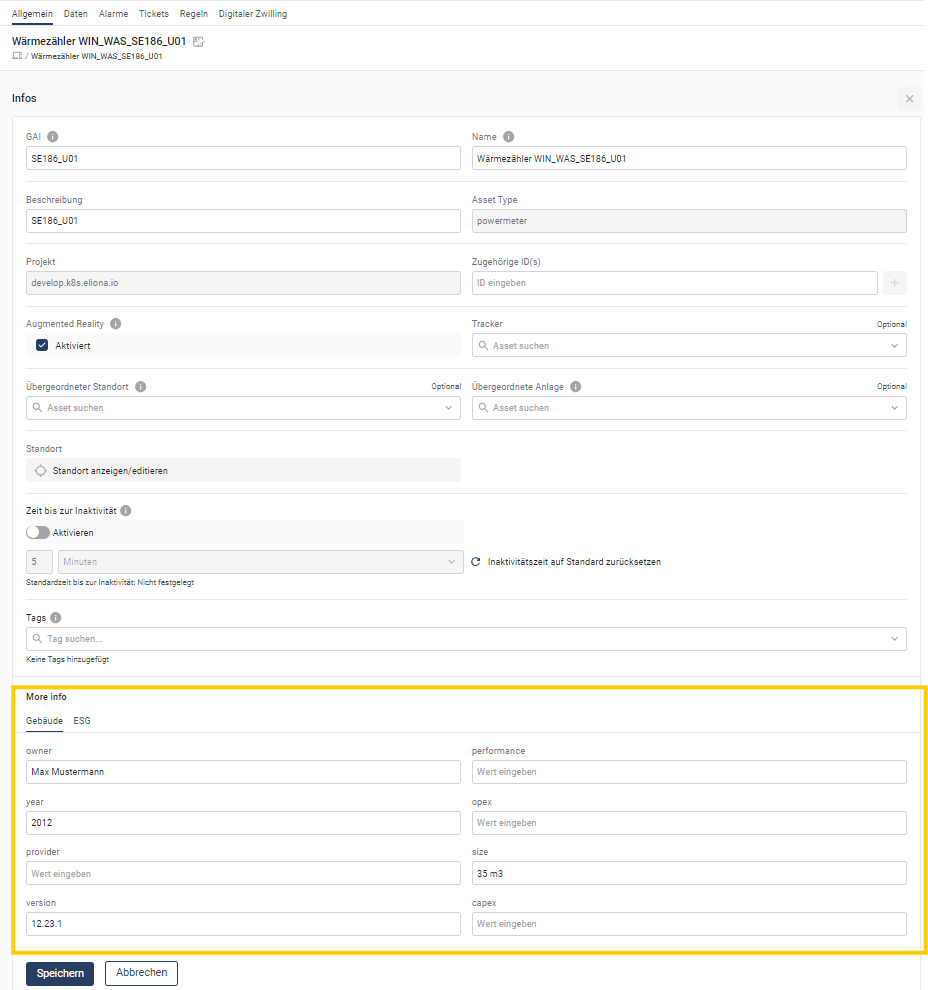
Now, for each asset in the asset details, **individual values** can be entered, allowing more precise and extensive documentation and contributing to better management and use.

<figure><img src="https://content.gitbook.com/content/Nyvwhz1kEMXcHf4HLuZ8/blobs/0YoLX0eJGroKt8qK65Qb/assetinfo.png" alt=""><figcaption></figcaption></figure>

These can then be expanded via "More Info".

<figure><img src="https://content.gitbook.com/content/Nyvwhz1kEMXcHf4HLuZ8/blobs/sUxrTsTAvwcFruIJjmI3/image.png" alt=""><figcaption></figcaption></figure>

### **Asset rating**

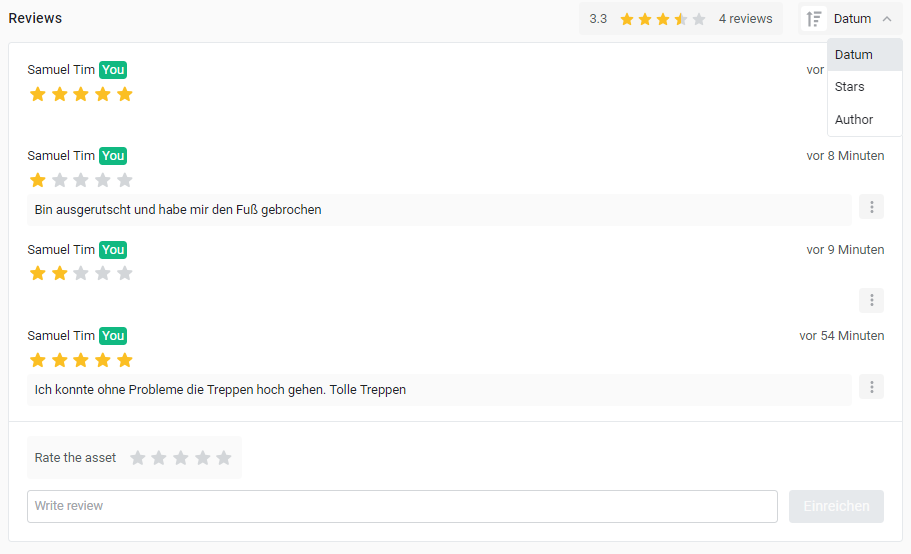
With the new **Asset rating** you can now rate your assets based on a **star rating system** . This feature makes it easier to assess the quality and condition of your assets and provides a quick overview of their performance and usefulness over time.

<figure><img src="https://content.gitbook.com/content/Nyvwhz1kEMXcHf4HLuZ8/blobs/fgVF41JQX5nORTpfRbrd/image.png" alt=""><figcaption></figcaption></figure>

The asset rating is now available in the asset details. You can give your assets 1 to 5 stars and add a rating text. These ratings can be edited or deleted at any time by their author. The ratings can be sorted by date, author, or star rating to get a quick overview.

### Improved tickets with template and default user

Our ticket system has been expanded and now offers numerous new functions that simplify handling, speed things up, and at the same time provide more information.

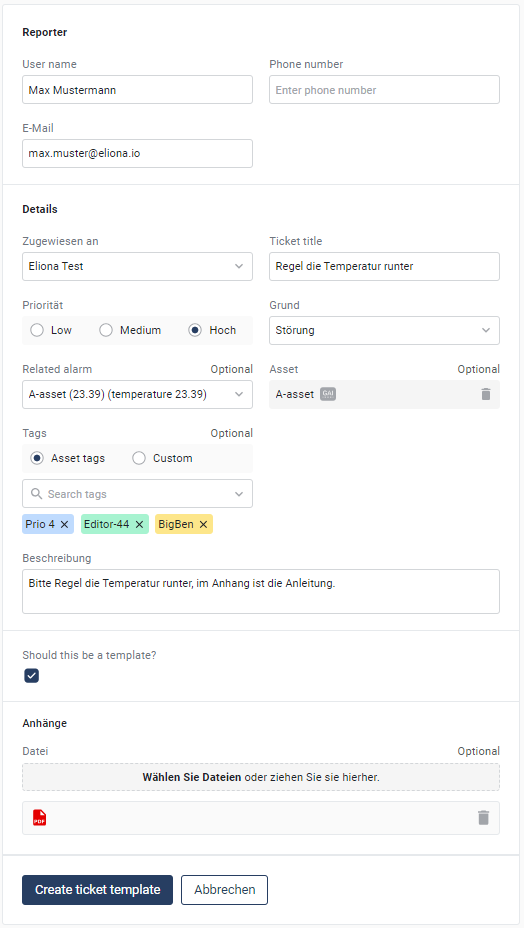
From now on, **a reporter is automatically** filled in for each ticket, which significantly speeds up the creation process. In addition, **three priority levels** are now available, enabling better classification and urgency assessment of tickets.

For improved clarity, **Tags** attachments can be added **. In addition, there is the possibility to** mark tickets as templates

<figure><img src="https://content.gitbook.com/content/Nyvwhz1kEMXcHf4HLuZ8/blobs/MJ4VOlAW9YG61PIocl9R/image.png" alt="" width="393"><figcaption></figcaption></figure>

. The templates are visible when the filter **"Templates"** is enabled in the ticket overview. Clicking a template opens a **pre-filled ticket**, which makes creating recurring tickets easier.

<figure><img src="https://content.gitbook.com/content/Nyvwhz1kEMXcHf4HLuZ8/blobs/GGkCymWfjjabr464T61k/image.png" alt=""><figcaption></figcaption></figure>

Another practical feature is setting a **default recipient**. This can be configured in the ticket overview by clicking the **gear icon** . This recipient is then automatically entered when creating all tickets, enabling faster and more convenient ticket creation.

<figure><img src="https://content.gitbook.com/content/Nyvwhz1kEMXcHf4HLuZ8/blobs/3G1Gd1MS31UORt7wa6v1/Ticket.png" alt=""><figcaption></figcaption></figure>

## 20240507 - Changelog \[v13.0.0]

We are pleased to present the latest version of Eliona:

Eliona v13.0. This version brings a variety of significant updates and new features that will greatly improve and expand your user experience. From improved tracking functions to extensive wayfinding options and a new booking system - this version offers everything you need to take your facility management and smart building solutions to the next level. Read on to learn more about the exciting new features and improvements Eliona v13.0 has in store for you.

### Full changelog

<details>

<summary>Changelog v13.0</summary>

\# Changelog

All notable changes to this project will be documented in this file.\
\##\[X.X.X] - TBD\
\
Dashboard/Smart view -> SBB widget ([SB-08710](https://app.asana.com/0/1200252355215223/1206904986524061/f))\[@sti]\
Dashboard/Smart view -> Alarm widget -> Detailed Alarm List ([SB-08721](https://app.asana.com/0/1200252355215223/1206055204586537/f))\[@sti]\
Asset Details Form -> Associated ID -> new input style for id\`s ([SB-08961](https://app.asana.com/0/1200252355215223/1207169605955829/f)) \[@sti]\
Sidebar -> Alarm Icon -> now showing different color depending on highest prio ([SB-08973](https://app.asana.com/0/1200252355215223/1206938387815576/f)) \[@sti]\
\
\
\##\[v13.0.0] - 16.05.24\
**### Added**\
Map -> Tracking feature with storey/room configurations, tracking widget and dynamic asset tree ([SB-08494](https://app.asana.com/0/1200252355215223/1206713482911294/f))\[@nl] \*\*\
Engineering -> Wayfinding -> Wayfinding editor, view and elements created (SB-08989) \[@nl] \*\*\
Engineering -> Bulk Import -> Bulk import feature (SB-08990) \[@lw] \*\*\
Map/Storey -> Booking -> Booking feature with configurations and elements (SB-08991) \[@jp] \*\*\
User -> Notification Settings -> user-specific notification settings (SB-08992) \[@lw] \*\*\
Connection > Added Modbus section ([SB-07300](https://app.asana.com/0/portfolio/1199554442331824/workload/1205755518393744)) \[@lwa] \*\*\
\- Dashboard -> Public (Global) dashboards -> feature with Public dashboards folder ([SB-08283](https://app.asana.com/0/1200252355215223/1206442272144245/f)) \[@jp] \*\*\
Settings -> Api keys -> added Api key expired Frontend info ([SB-08365](https://app.asana.com/0/portfolio/1199554442331824/workload/1205844913992583)) \[@rtu]\
Scripts -> added default function to python scripts \[@lwa]<br>

**### Changed**\
\
\- Audit trail, Script engine -> store sorting config in URL ([SB-08426](https://app.asana.com/0/1200252355215223/1206579113932464/f)) \[@nl]\
\- General -> Storey & Bim redirects -> unified across whole platform ([SB-08965](https://app.asana.com/0/portfolio/1199554442331824/workload/1207171019673790)) \[@rtu]\
\- Apps -> Updated visual representation for versions ([BR-2624](https://app.asana.com/0/1187198351569417/1206896340722163/f))\[@lwa]\
\- Engineering -> Tag Management -> Remove custom flag from tags ([SB-08693](https://app.asana.com/0/portfolio/1199554442331824/workload/1206832856885856))\[@rtu]

\
**#### Fixed 🐞**\
\- Dashboard -> Trend Element -> fixed, guideline ([BR-2533](https://app.asana.com/0/portfolio/1199554442331824/workload/1206677739889403)) \[@rtu] \*\*\
\- Dashboard -> Custom widget -> table and trend element preview ([BR-2591](https://app.asana.com/0/1187198351569417/1206808231772682/f) [BR-2590](https://app.asana.com/0/1187198351569417/1206807625187469/f)) \[@nl]\
\- BIM details-> Sidebar -> fixed displaying "Tracker" list item ([BR-2587](https://app.asana.com/0/1187198351569417/1206795548002131/f))\[@nl]\
\- Connection -> Fixed redirect errors in the restful section ([BR-2593](https://app.asana.com/0/1187198351569417/1206808953568816/f)) \[@lwa]\
\- Connection -> Fixed that uncreated connection would test status ([BR-2592](https://app.asana.com/0/1187198351569417/1206808716071331/f)) \[@lwa]\
\- Asset -> Data -> show aggregation data for average on change mode ([BR-2597](https://app.asana.com/0/portfolio/1199554442331824/workload/1206830213335903)) \[@rtu]\
\- General -> Asset attribute select -> show separate options for average on change and cusum modes ([BR-2602](https://app.asana.com/0/1187198351569417/1206840261685318)) \[@rtu]\
\- Reporter -> Text Element -> pipeline requirement options now check actual pipeline configuration not asset type config ([BR-2605](https://app.asana.com/0/1187198351569417/1206842982206762)) \[@rtu]\
\- Settings -> Apps -> Remove required fields from adding Niagara controller dialog ([BR-2580](https://app.asana.com/0/1187198351569417/1206776141023041)) \[@rtu]\
\- General -> Asset/Attribute Select -> Remove non-existing min & max options from sum & cusum aggregation selects ([BR-2605](https://app.asana.com/0/portfolio/1199554442331824/workload/1206842982206762)) \[@rtu]\
\- Engineering -> Asset Editor -> fix bulk asset import ([BR-2619](https://app.asana.com/0/portfolio/1199554442331824/workload/1206888522576446)) \[@rtu]\
\- General -> Asset Status -> show unmonitored asset if allowed inactivity is disabled ([BR-2440](https://app.asana.com/0/portfolio/1199554442331824/workload/1206446221783781)) \[@rtu]\
\- General -> Experts -> Mark tags where user doesn't have access for Expert users ([SB-08367](https://app.asana.com/0/portfolio/1199554442331824/workload/1206580909208644)) \[@rtu]\
\- Smart view -> Input Widget -> transparent background buttons ([BR-2636](https://app.asana.com/0/1187198351569417/1206430901344036/f)) \[@sti]\
\- Digital twin -> Link Asset -> All Assets are linkable now ([BR-2635](https://app.asana.com/0/1187198351569417/1206917468535292/f))\[@sti]\
\- Settings -> Apps -> InQuery-Parameters aren't submitted ([BR-2643](https://app.asana.com/0/portfolio/1199554442331824/workload/1206977527219147)) \[@rtu]\
\- Dashboard -> Storey widget -> Tooltip fixed ([BR-2532](https://app.asana.com/0/1187198351569417/1206676561646395/f))\[@sti]\
\- Dashboard -> Storey widget -> preview image -> fixed image location([BR-2499](https://app.asana.com/0/1187198351569417/1206611750829297/f))\[@sti]\
\- Dashboard->Heatmap widget -> preview storey -> now showing storey instead of map ([BR-2499](https://app.asana.com/0/1187198351569417/1206611750829297/f))\[@sti]\
\- Settings -> Apps -> apps grid now fits when having different window sizes ([BR-2650](https://app.asana.com/0/1187198351569417/1206999597587058/f))\[@sti]\
\- Login -> Fixed that version wasn't always up to date ([BR-2598](https://app.asana.com/0/1187198351569417/1206830754547357/f))\[@lwa]\
\- Assets -> Details -> Attributes -> fixed changing attribute values and displaying them correctly ([BR-2632](https://app.asana.com/0/1187198351569417/1206921886605937/f)) \[@sti]\
-Assets -> Details -> Attributes -> calculator -> calculator now showing default from template ([BR-2628](https://app.asana.com/0/1187198351569417/1206906001111932/f)) \[@sti]\
-Alarms -> asset type definition -> disabled changing subtype ([BR-2294)](https://app.asana.com/0/1187198351569417/1206064779554772/f) \[@sti]\
-Map -> Markers -> circle markers are now on top of building markers ([BR-2670](https://app.asana.com/0/1187198351569417/1207054890235484/f)) \[@sti]\
-Analytics -> Settings -> enhance legend templating variables with aggregation props ([BR-2677](https://app.asana.com/0/portfolio/1199554442331824/workload/1207086400445912)) \[@rtu]\
\- Smart view -> fixed property that caused wrong color ([BR-2682](https://app.asana.com/0/1187198351569417/1207088122108649/f)) \[@lwa]\
\- api keys -> fixed wrong date format ([BR-2680](https://app.asana.com/0/1187198351569417/1207087102839792/f)) \[@lwa]\
-Smart View -> dynamic text -> font now correctly displayed ([BR-2684](https://app.asana.com/0/1187198351569417/1207110797258505/f)) \[@sti]\
-Smart View -> comfort -> text stays inside the box for bigger font sizes ([BR-2684](https://app.asana.com/0/1187198351569417/1207110797258505/f)) \[@sti]\
-Smart View -> image-> preview of image gets deleted when image gets deleted ([BR-2684](https://app.asana.com/0/1187198351569417/1207110797258505/f)) \[@sti]\
\- Connection -> Mqtt connections can now be disabled on the detailed page ([BR-2688](https://app.asana.com/0/1187198351569417/1207111890387378/f)) \[@lwa]\
\- Appstore -> updated UI so it is more intuitive to see if a new version is available ([BR-2624](https://app.asana.com/0/1187198351569417/1206896340722163/f)) \[@lwa]\
-Smart View -> Input -> Switch -> Switch now showing On/Off above the switch ([BR-2703](https://app.asana.com/0/1187198351569417/1207156693733571/f)) \[@sti]\
-Map -> Storey -> Poi can now be placed on polygon ([BR-2709](https://app.asana.com/0/1187198351569417/1207160070505599/f)) \[@sti]\
-Assets -> Details -> Attributes -> Filter can now be saved/deleted and it shows the saved configuration [(BR-2631)](https://app.asana.com/0/1187198351569417/1206921718715250/f) \[@sti]\
-Assets -> Details -> Attributes -> Units can be changed without error [(BR-2663](https://app.asana.com/0/1187198351569417/1207035232245285/f)) \[@sti]\
-Engineering -> Asset Modelling -> Attribute Templates -> Virtual activated saving only possible when form is filled in ([BR-2673](https://app.asana.com/0/1187198351569417/1207064731067058/f)) \[@sti]\
-Smartview -> Smartview inputs are disabled for smartview user ([BR-2712](https://app.asana.com/0/portfolio/1199554442331824/workload/1207178714585122)) \[@rtu]\
-Login page -> Remember me checkbox is removed ([BR-2138](https://app.asana.com/0/1200252355215223/1206621400368363/f)) \[@jp]\
-Smartview -> Tickets changable text styles/Trend underline now possible/Sankey bold now working/general form inconsistencies fixed ([BR-2724](https://app.asana.com/0/1187198351569417/1207220960917233/f)) \[@sti]\
-Tickets -> Comments -> when adding a comment it instantly shows your name above the comment now. ([BR-2711](https://app.asana.com/0/1187198351569417/1207178258646554/f)) \[@sti]\
-Engineering -> My Profile -> fix not showing user default location ([BR-2755](https://dev.azure.com/eliona/core/_git/frontend/pullrequest/6452)) \[@rtu]\
-Settings -> Audit trail -> Remove archived users from performed by filter ([BR-2756](https://dev.azure.com/eliona/core/_git/frontend/pullrequest/6453))\[@rtu]

<br>

</details>

### Tracking

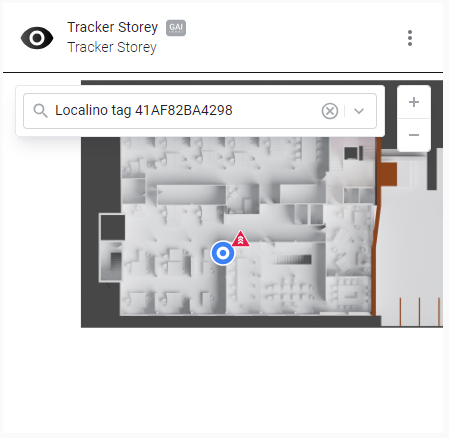
We are pleased to present some exciting news in the area of tracking. With the latest version, it is now possible to use the **Localino app, trackers and anchors** to create them and display their locations as well as **movements live** on the floors. This functionality is supported by a new tracking widget, which even makes it possible to divide floors into individual rooms.

#### Asset modelling

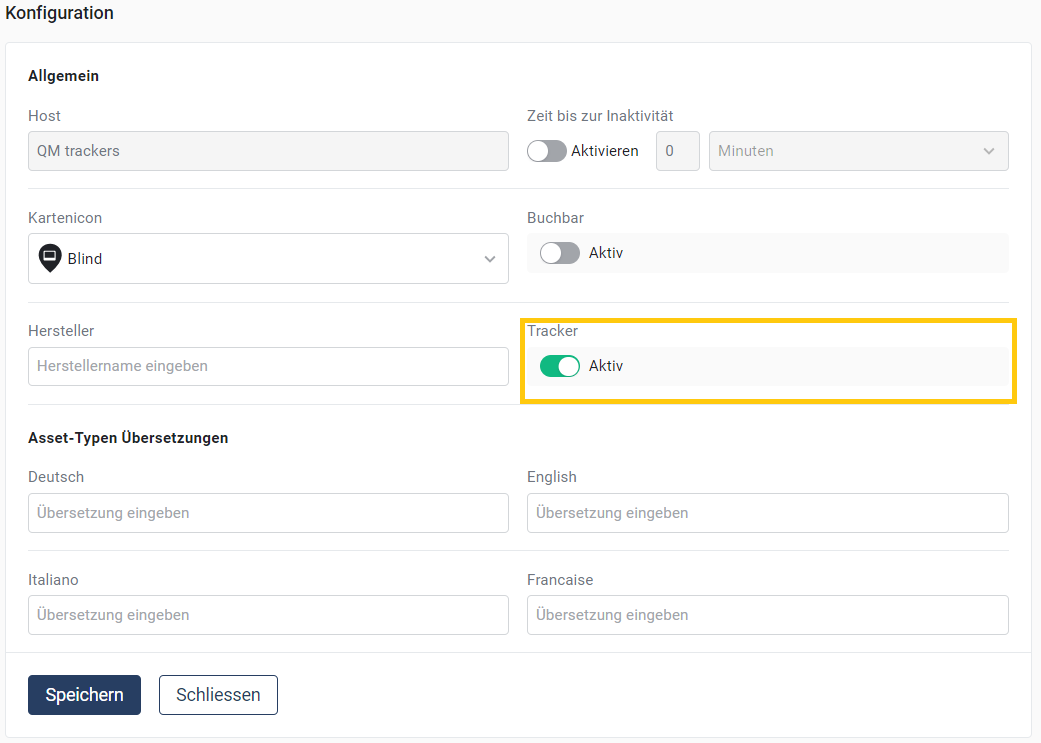
In asset modelling, the new item **"Tracker"** has been added. If this is enabled, the created assets are registered in the system as **trackers**. This allows additional, arbitrary attributes to be added to a tracker, making your data even more precise and comprehensive.

<figure><img src="https://content.gitbook.com/content/Nyvwhz1kEMXcHf4HLuZ8/blobs/2hrn77xAXIV1jctH1ovO/Screenshot%202024-05-13%20142926.png" alt=""><figcaption></figcaption></figure>

#### Configure asset info

You now have the option to select a **tracker**in an asset's configuration. If a tracker is selected, this asset is marked with a **blue dot** and can no longer be moved in the geographic asset structure. From now on, the **real location** of the asset determines where it is found in the geographic structure. This means you can see where the tag is by looking only at the asset structure.

![](https://content.gitbook.com/content/Nyvwhz1kEMXcHf4HLuZ8/blobs/BwomNFXKRQcOJhioKEYu/image.png) ![](https://content.gitbook.com/content/Nyvwhz1kEMXcHf4HLuZ8/blobs/sY6Nu6FrWU0rGF5L8Wy1/image.png)

#### Configure floor

There is now the new "Configure floor" option on the floor. Here, the **anchors can be selected** and the height of the anchors adjusted so they match the real-world conditions.![](https://content.gitbook.com/content/Nyvwhz1kEMXcHf4HLuZ8/blobs/GG4ZTkBoU7XSqe5UndlO/image.png)

After clicking **"Next"** a rectangle with the relative positions of the anchors is displayed. This rectangle can be resized and rotated as desired so that the positions of the anchors in the **real world** match the positions on the **digital floor**.

{% embed url="<https://drive.google.com/file/d/15FbR4qRRvTXsOvzm_sT2xdjzFi35hoxA/view?usp=sharing>" %}

#### Set up rooms

If needed, rooms can now also be set up. This makes it possible to record exactly which room the tag is in. This information is reflected both in the asset structure and in the tracking widget. To define a room, draw a polygon on the floor as usual and activate the option **"Set polygon as room boundaries"**. The room is then set up. ![](https://content.gitbook.com/content/Nyvwhz1kEMXcHf4HLuZ8/blobs/voR2Qm6Ux8nrEGngdbKd/image.png)

#### Tracking widget

The new tracking configurations also include, of course, a tracking widget that is available for both **dashboards** and the **Smart View** . Select a floor, and all trackers on that floor will be displayed. At the top of the widget there is a search bar with which you can search for trackers specifically. When a tracker is selected, **the widget follows it**. If the tracker changes room or floor, this is immediately visible in the widget.

<figure><img src="https://content.gitbook.com/content/Nyvwhz1kEMXcHf4HLuZ8/blobs/J328qxNGojsXfBgflyCm/image.png" alt=""><figcaption></figcaption></figure>

### Wayfinding

One of the major new additions is wayfinding. Here it is possible to **configure routes across floors** and thus guide customers and employees to their destination via the **fastest route** without getting lost and without accompaniment. To record your facility, there is now the new "Wayfinding" option under "Engineering".

#### Add building

To create a building with floors, click the "+ building" button. You can now assign names to your building and its floors and select the associated assets.

![](https://content.gitbook.com/content/Nyvwhz1kEMXcHf4HLuZ8/blobs/oKD7iC3jOiRYRMEa8lou/image.png)

<figure><img src="https://content.gitbook.com/content/Nyvwhz1kEMXcHf4HLuZ8/blobs/f6tNr7hJgqh63nSFbqEQ/image.png" alt=""><figcaption></figcaption></figure>

After saving, the individual floors can be configured. Simply expand the building and click the arrow of the desired floor.

<figure><img src="https://content.gitbook.com/content/Nyvwhz1kEMXcHf4HLuZ8/blobs/sV6VAZwPhI95BryFO1iZ/Screenshot%202024-05-13%20111948.png" alt=""><figcaption></figcaption></figure>

#### Configure floor

To equip the floor with routes, any image of the floor can now be uploaded. Then you can **add start/end locations, paths, elevators and stairs via drag & drop** . To link them, small **blue dots** appear around the selected points. If you drag them and release them on another point or line, they are linked.

{% embed url="<https://drive.google.com/file/d/1vqnOYgZTRqoe2y2biGEbFNEoWzPLbnbm/view?usp=sharing>" %}

#### Elevators and stairs

To connect the floors with each other, stairs and elevators can be placed. These can be assigned to a group. In this way, elevators and stairs in a group are **linked across floors,** and the fastest route via an elevator to another floor can be found.

![](https://content.gitbook.com/content/Nyvwhz1kEMXcHf4HLuZ8/blobs/ltEIkH58XVmfhSKqqUbt/image.png)

#### QR code

To use the set up wayfinding building, a QR code is generated for each starting point, which can be easily downloaded by selecting the point and clicking the QR code icon.

<figure><img src="https://content.gitbook.com/content/Nyvwhz1kEMXcHf4HLuZ8/blobs/mxHZna3EIpdpVhZHuGJ7/Screenshot%202024-05-13%20132416.png" alt=""><figcaption></figcaption></figure>

#### Wayfinding view

When the QR code is scanned, you end up in the wayfinding view, where the starting point is the scanned asset. Here you can enter your destination in a search bar and then you can start on the fastest route to your destination.

In the **Smart View** there is of course also a wayfinding component. Here the start asset can be selected and the possible destinations can also be defined as desired.

{% embed url="<https://drive.google.com/file/d/1_K-p8PX2b-VoW4_bw62yK_J-xnERrnGw/view?usp=sharing>" %}

### **Booking**

A new booking system is now available and significantly improves facility management and scheduling. It is now possible to create bookable assets via our "Booking" app and book them in the new **"Booking widget"** .

#### Modelling

In asset modelling, it is now possible to enable the item **"Bookable"**&#x69;n the configuration of asset templates. This automatically creates two new attributes that are necessary for the booking function.

<div data-full-width="false"><figure><img src="https://content.gitbook.com/content/Nyvwhz1kEMXcHf4HLuZ8/blobs/rtilYCZnrYXYimLl7l0M/Screenshot%202024-05-10%20090058.jpg" alt=""><figcaption></figcaption></figure></div>

#### Make floor bookable

With the now created bookable assets, it is now possible, when placing polygons or points of interest, to activate the option **"Asset can be booked"** . This means the asset can now be booked in the booking widget.

<figure><img src="https://content.gitbook.com/content/Nyvwhz1kEMXcHf4HLuZ8/blobs/LAmZzUMjafAmzO73Wo8m/Screenshot%202024-05-10%20092140.png" alt=""><figcaption></figcaption></figure>

#### **Booking widget**

It is now possible in the booking widget via **"Quick Booking"** or **"Advanced Booking"** to book the desired time slots very precisely. Of course, this feature is also available in the Smart Views.

{% embed url="<https://drive.google.com/file/d/1h_L7pb6U6LtHbQJIT5rQZseu4L6D1uSn/view?usp=sharing>" %}

### **Bulk import**

It is now possible to import all desired data at once with a file. Assets, rules, tags, projects, roles, and types can be imported.

#### Importing

For bulk import, we have added a new option in "Engineering". The JSON file with the data can be uploaded here very easily.

<figure><img src="https://content.gitbook.com/content/Nyvwhz1kEMXcHf4HLuZ8/blobs/OPu9G2U5q7yTGlNfb05o/Screenshot%202024-05-10%20121247.png" alt=""><figcaption></figcaption></figure>

If there are **errors** in the file, they will of course be displayed and can be **corrected** in the app.

<figure><img src="https://content.gitbook.com/content/Nyvwhz1kEMXcHf4HLuZ8/blobs/d0eWbVkSaCUSOkeC5EsW/Screenshot%202024-05-10%20121545.png" alt=""><figcaption></figcaption></figure>

The data is then clearly displayed in a table. With **"Overwrite already imported data"** already existing data can be overwritten and with **"Highlight duplicated assets"** duplicate data are highlighted. With a **double-click** individual data points can now still be edited as desired. After you have checked the boxes to decide which data should be imported, click on **"Test Import"**, to get feedback on whether the import will be successful. Finally, simply click "Import" and your data will be imported.

{% embed url="<https://drive.google.com/file/d/1VP0Da4daofHHv0aOBQBrzHk7X1tHXFkj/view?usp=sharing>" %}

### **Public Dashboards**

The long-awaited Public Dashboards are here. Now you can make your dashboards permanently visible to all participants in the project, making constant copying unnecessary.

When creating a dashboard, it is now possible to choose between **"User"** and **"Project"** can be distinguished. If you select "User", you get the familiar dashboards. If you select "Project", this dashboard is visible to everyone in the project. Public dashboards are marked with a **blue dot** marked. Only you can edit and delete your created "Public Dashboard".![](https://content.gitbook.com/content/Nyvwhz1kEMXcHf4HLuZ8/blobs/pZ0tHPkqjkemxKk61l32/image.png)

### Tags

With the expert role, it is possible to add or remove all tags from an asset. For better clarity, tags that the expert does not have access to are now marked with a **red dot** marked. In addition, the expert is always warned when he removes all tags to which he has rights and thereby loses rights to the asset.

<figure><img src="https://content.gitbook.com/content/Nyvwhz1kEMXcHf4HLuZ8/blobs/x5BrmedVkr8i0bQnBAGq/image.png" alt=""><figcaption></figcaption></figure>

### Analytics

In the settings of an analytic, there is now a new field **"Series label format"**. This field can be used to specify variables for aggregated values to customize the displayed value. {{unit}}, {{attribute}}, {{aggregatedDataField}}, {{aggregatedDataRaster}}, and {{aggregatedDataType}} are available variables for customizing the label as desired.

<figure><img src="https://content.gitbook.com/content/Nyvwhz1kEMXcHf4HLuZ8/blobs/ZovFMspjv6HoruAQLSDY/Screenshot%202024-05-13%20091047.png" alt=""><figcaption></figcaption></figure>

### Digital Twin

With the digital twin, it was previously only possible to link assets that were sub-assets. With the new version, it is now possible, in a digital twin, to link all **assets to link**.

### Floor

It is now possible without any problems, on the floor **points to polygons** to set.

### Login

We fixed a bug that caused the displayed version not to always be the latest one. Now the **correct version** is always displayed.

In addition, since it was rather a burden, the **"Remember me" box** removed. We will now remember you by default at login.

### Calculator

The calculator in an asset's attribute form now takes over and displays the **default calculation** entered in "Asset Modeling".

There are also no more problems with calculations with **more than 7 variables**. All your calculations now work with any number of variables.

### Data

If the aggregation of an attribute is set to **"average on change"** these data are now visible in an asset's data. All you need to do is click on the **small clock** .<img src="https://content.gitbook.com/content/Nyvwhz1kEMXcHf4HLuZ8/blobs/cKwMSC3s2sc8vSfByjCK/Screenshot%202024-05-10%20165218.png" alt="" data-size="original">

### **Modbus Connection**

Modbus is a tried-and-tested communication protocol. You can now connect your Modbus devices with Eliona under **Connection -> Modbus** your Modbus devices to Eliona.

### **API keys with expiration information**

API keys now display the **expiration date** and an indication when a key has expired.

<figure><img src="https://content.gitbook.com/content/Nyvwhz1kEMXcHf4HLuZ8/blobs/UlhcFJ4i81wlSogqTXxL/image.png" alt=""><figcaption></figcaption></figure>

### Notification settings

There is now the option to personalize notifications. In your **profile under "Notification settings"** you can select in great detail which notifications you would like to receive.

<figure><img src="https://content.gitbook.com/content/Nyvwhz1kEMXcHf4HLuZ8/blobs/0S6klXJkLjN1kOETCSxl/Screenshot%202024-05-14%20095523.png" alt=""><figcaption></figcaption></figure>

***

## 20240304 - Changelog \[v.12.1]

We are pleased to present the latest version of Eliona: Eliona v12.1.

In this release, we fixed many smaller bugs. The most important changes are presented here in detail. A complete list of all changes can be found below.

### [↗ Widget "Storey"](/collection/english-v14/documentation/widgets/vordefinierte-widgets/stockwerk.md):

We fixed a bug that caused the "Zoom in / Zoom out" buttons to cover the "More options" menu item.

### [↗ Digital Twin](/collection/english-v14/documentation/digitaler-zwilling.md):

We fixed a bug that could prevent images from being uploaded to the Digital Twin

### [↗ Slider](/collection/english-v14/documentation/smart-views/slider-gruppen.md):

We fixed a bug that could cause trends to not be displayed in the slider.

### [↗ Map](/collection/english-v14/documentation/karte-und-stockwerk/karte.md)

We fixed a bug that caused no alarm indicators to be shown above the map icons in the sidebar of the "Map" menu when an alarm was present.

### [↗ Alarms](/collection/english-v14/documentation/alarme-regeln-und-eskalationen/alarme.md)

We fixed a bug that caused the "Heatmap" field to be displayed incorrectly in the alarm statistics.

### [↗ Roles](/collection/english-v14/documentation/rollen.md)

The predefined role "Leicom" has been removed.

### [↗ Script Engine](/collection/english-v14/documentation/engineering/skript-engine.md)

We closed a security vulnerability related to the script engine

### [↗ Escalations](/collection/english-v14/documentation/alarme-regeln-und-eskalationen/eskalationen.md)

If alarms were to be escalated by email and a custom template was used for the email, it was possible that the email would not be delivered if the template used was faulty.

This behavior has been changed. From now on, such emails will also be sent if a faulty template is present. In this case, the default template will be used instead.

### Full changelog

<details>

<summary>Changelog v12.1</summary>

**Database**\
\## \[v12.1.0] - 2024-03-04

\- hardcoded role "leicom" no longer exists \[@al]\
\- privileges divided into owner and user of the database objects \[@al]\
\- heap tuples created together with asset \[@les]\
\- fix for replication and publication of tables \[@al]

\## \[v12.0.2] - 2024-02-09 (intermediate for v12.1.0)

\- fixed security issues with customer scripts (app role) \[@al]\
\- fixed policy for assets that allows all projects to which the user is assigned \[@al]\
\- better performance for heap notify trigger \[@al]\
\- the pipeline trigger is only activated if "his" flag is set \[@al]

\## \[v12.0.1] - 2024-02-28

\- hotfix for "api" privilege to audit.heap \[@al]\
\- trigger for tags changed to increase performance \[@al]

**Frontend**\
\## \[v12.0.1] - 2024-03-04

\### Changed\
opcua -> improved section, added namespaces, better connection status feedback and improved variable naming (SB-08156) \[@lwa]

\#### **Fixed** ![:marienkäfer\_1:](https://a.slack-edge.com/production-standard-emoji-assets/14.0/apple-medium/1f41e.png)

\- Digital Twin -> fixed image uploading BR-2452 \[@nl] \*\*\
\- Digital Twin -> fixed initial placement of the image on small screens BR-2524 \[@nl]\
\- Connection/Engineering/Settings -> fixed opening sections in new tabs BR-2453 \[@nl]\
\- Alarm Notifications -> fixed notifications remain after logout BR-2437 \[@nl]\
\- Widget details -> Value tiles -> fixed attribute name displaying in the preview BR-2445 \[@nl]\
\- Slider -> fixed showing asset data in slider views BR-2459 \[@rtu] \*\*\
\- Apps -> fixed that payload would only contain name BR-2356 \[@lw]\
\- Filters -> fixed that filter info wouldn't get sent to the server \[@lw]\
\- Apps -> fixed that not initialized apps but installed apps couldn't be uninstalled (BR-2356) \[@lwa]\
\- Widgets -> Input widget -> fixed: changing the attribute value doesn't work when one of the attributes in the widget configuration is removed (BR-2458) \[@nl]\
\- Map -> missing alarm icons in sidebar / assets tree (BR-2461) \[@nl] \*\*\
\- Escalation -> can't add "Slack" target (BR-2465) \[@nl]\
\- Dashboard -> Value tiles -> fix value tiles description (BR-2467) \[@rtu]\
\- Dashboard/Smartview -> Calendar -> fix underlapped tooltip (BR-2462) \[@rtu]\
\- Password reset -> fixed (BR-2468) \[@nl]\
\- Smartview -> fix chart range for aggregated bar values (BR-2489) \[@rtu]\
\- Engineering -> Notification Providers -> Email -> fix initial auth configuration (BR-2471) \[@rtu]\
\- Bookmarks -> can't select a user to add a bookmark to them \[BR-2500] (@nl)\
\- Dashboard -> Storey widget -> Map controls cover widget context menu button (BR-2497) \[@nl] \*\
\- Map -> Storey -> updates the attribute values of selected assets only (BR-2498) \[@nl]\
\- Dashboards -> Breadcrumbs -> fix folder navigation to dashboard list (BR-2503) \[@rtu]\
\- My Profile -> Password reset -> fix dialog behavior on closing the dialog (BR-2509) \[@rtu]\
\- Alarms -> Alarm Statistics -> use selected date range for the heatmap (BR-2506) \[@rtu] \*\
\- Rules -> Rule Details -> fix cancel button behavior to navigate back in history (BR-2507) \[@rtu]\
\- Asset -> exclude subtype output from validity check and time to inactivity (BR-2496) \[@rtu]\
\- Asset -> Details add link from asset type to asset modeling (BR-2493) \[@rtu]\
\- Tag Management -> Users -> adding tags to users depends on project tag access or expert mode (BR-2516) \[@rtu]\
\- General -> Datapoint select -> fix select options for avg-on-change ag options \[BR-2531] (@rtu)

**Escalation**\
\## \[v12.0.2] - 2024-02-26

\- hotfix for checking HTML validity in the mail template \[@al]

\## \[v12.0.1] - 2024-02-06

\- hotfix for handling the default HTML template \[@al]

**Jobsync**\
\## \[v12.0.1] - 2024-02-09

\- Fixed a deadlock occurring during Kafka broker failure

**Url-bridge**\
\## \[v12.0.1] - 2024-02-13

\- Fixed bug causing jobs to fail when proxy is not defined

**Webhook**\
\## \[v12.0.1] - 2024-02-13

\- Modified auth sequence

**Adfs**\
\## \[v12.0.3] - 2023-02-22

\- customizable error page in case of failed login \[@csa]\
\- database code without hardcoded "leicom" user \[@al]

\## \[v12.0.1] - 2023-02-12- enable attribute mapping for permissions and language \[@csa]\
\- restart if config changes \[@csa]

**Equinix**\
\## \[v11.1.1] - 2023-12-01

\### **Added** ![:rakete:](https://a.slack-edge.com/production-standard-emoji-assets/14.0/apple-medium/1f680.png)\
\- Map all Equinix status strings to numbers \[@csa]\
\- Add attribute mapping for numbers \[@csa]\
\- Importer via APIv2 instead of DB connection \[@csa]### Fixed\
\- IBX Assets API endpoint \[@csa]

**Niagara**\
V12.0.1\
\[fix] access config update

**Webpusher**\
\## \[v12.0.1] - 2024-05-02

\- Schema creation enforced \[@les]\
\- Fixed user\_id extraction from events \[@les]

**Xovis**\
\## \[v12.1.0] - 2023-02-12\
\- remove user leicom from db init \[@al]

\## \[v12.0.1] - 2023-02-12\
\- upsert data via APIv2 \[@csa]

</details>

## 20240130 - Changelog \[v12.0.0]

We are pleased to present the latest version of Eliona.

Eliona v12.0.0 is a big step forward and introduces important innovations, such as the App Store. Many small improvements also ensure that your work with Eliona becomes more intuitive than ever before.

The first thing you will notice in this version is the new design: We have modernized the look of Eliona and made it even more user-friendly.

But that is by no means all. Many new features are waiting to be tried out by you! In this entry, we present the most important changes in detail. A complete list of all changes can be found at the end of this entry.

### [↗ Connections](/collection/english-v14/connectivity-as-a-service/gerate-mit-abb-buildingpro-verbinden.md): MQTT Publishing

With Eliona v12.0.0, it is now possible to publish MQTT messages. This allows Eliona to integrate even more deeply into your infrastructure and be used even more flexibly.

### App Store

With the Eliona Marketplace, we provide a curated selection of dozens of apps. Apps are specifically tailored to individual use cases and expert systems and automatically integrate incoming data from third-party sources into Eliona.

Apps are much more than ordinary integrations: an installed app automatically creates all required assets and contains individual dashboards. These enable users to interact smoothly with external systems in a higher-level application.

Apps make Eliona an open, modular platform that bundles a wide range of complex expert systems in a single, familiar environment with optimized usability and well-thought-out application concepts.

So that the right app can be found for truly every conceivable scenario, Eliona provides all necessary information openly and free of charge via GitHub. With little effort, you can create your own apps and adapt Eliona to the specific requirements in your infrastructure.

[↗ Learn more about apps](/collection/english-v14/apps/apps.md)

### [↗ Tags](/collection/english-v14/documentation/tags.md): Categories

The tag functionality has been significantly expanded. From now on, it is possible to organize tags into categories. Categories can be marked as favorites and arranged in sequences. These categories can be used to control which tags appear in the alarm overview.

↗ Learn more about tags

### [↗ Alarms](/collection/english-v14/documentation/alarme-regeln-und-eskalationen/alarme.md): Revised interface

The alarm overview has been redesigned and the following changes have been made:

#### Visual notifications

When an alarm is triggered, visual notifications are now displayed in addition to the notification sound. This notification remains on the screen until it is clicked away. This introduces additional redundancy, so that existing alarms are immediately visible even if the notification sound was missed.

#### New columns "GAI" and "Value"

From now on, the alarm overview shows the GAI of the affected asset, as well as the value.

#### Columns can be individually arranged, shown, and hidden

{% embed url="<https://drive.google.com/file/d/1jYzURlF-enwVfXIBqCrFkfQvu2FGVyT0/view?usp=share_link>" %}

Using the "Columns" button, the columns in the alarm overview can now be arranged as desired. Columns can also be shown and hidden.

#### Column "Message"

{% embed url="<https://drive.google.com/file/d/1x6tp4RQvftg1JoXyUJecZMB3ZZ_nS9B3/view?usp=share_link>" %}

The "Message" column now displays more content. The content of this column is not truncated. If there is more content than can be displayed, the message can be scrolled.

#### Column "Tags"

From now on, only tags that are in categories are shown in the alarm overview. The order in which the tags are displayed depends on their position in the sequence.

You can still see all tags if you enable the "Detailed view".

### [↗ Navigation](/collection/english-v14/preface/bedienelemente.md): Various changes

Some improvements have been made to navigation in Eliona:

#### Breadcrumbs

A "breadcrumb" element now appears in the context bar. Using this element, you can immediately see your exact position in Eliona and quickly navigate to higher-level menus.

#### Filters are retained when changing pages

{% embed url="<https://drive.google.com/file/d/1yAFSk4MOxd2xFnRT4yRaJfYr5Ua4dmRT/view?usp=sharing>" %}

If you search through a list, e.g. the assets overview, using filters, your set filters will now be retained when you select an entry and then go back to the overview.

#### The Eliona internal "Back" button has been removed

To make the above-mentioned retention of filters work, the browser's "Back" button must be used. Therefore, we have removed the Eliona internal "Back" button.

#### Mute is now displayed

<div data-full-width="true"><figure><img src="https://content.gitbook.com/content/Nyvwhz1kEMXcHf4HLuZ8/blobs/R4ehamsHtEky6E5rQspM/Docs_Benachrichtigung%20-%20Stummschaltung.png" alt=""><figcaption></figcaption></figure></div>

If you mute notifications in Eliona, this is now shown in the corresponding icon.

### [↗ Rules](/collection/english-v14/documentation/alarme-regeln-und-eskalationen/regeln.md): Asset Validity

We have added a new type of rule: *Asset Validity*. With this type of rule, you can be notified when the status of an asset changes.

[↗ Learn more about the asset status](/collection/english-v14/documentation/assets/asset-status-aktive-inaktive-nicht-uberwachte-assets.md)

### [↗ Roles](/collection/english-v14/documentation/rollen.md): Users in other lists

We have created a new option in the project roles: *See users in other lists*. Until now, users who did not have access to the "Users" option in their system role could not see user names in various places in Eliona, e.g. in tickets. With this option, users can now see the names of other users even if they do not have access to the "Users" menu.

### Calculator: Values from other assets

From now on, values from another asset can be included in the calculator.

### Fixed bugs

#### Automatic log-out on dynamic pages

Previously, users did not receive any new data on dynamic pages, e.g. the alarm overview, after 8 hours. This was not immediately apparent to users because they were not logged out and could therefore lead to misunderstandings.

The behavior has been changed: users are now automatically logged out after 10 hours.

#### Inconsistencies in the licenses

A bug that caused inconsistencies in the display of license costs has been fixed.

#### Connections: Crashes with MQTT, OPC UA, and Kafka

A bug was fixed that could cause Eliona to crash under certain conditions when the connection methods "MQTT", "OPC UA", and "Kafka" were called.

#### Widgets: Incorrect display in "Trend with bars"

The "Trend with bars" widget could display incorrect content under certain conditions. This bug has been fixed.

#### Widgets: Automatic refresh in the "iFrame" widget disabled

The "iFrame" widget refreshed itself every 5 minutes by default. Changes made in this widget were lost after these 5 minutes. This behavior has been changed; automatic refresh is now disabled.

#### Assets: Incorrect display of images

If images were uploaded via macOS or iOS and assigned to assets, it could happen that these images were displayed rotated incorrectly. This bug has been fixed.

## 20240112 – Changelog \[v11.1.8]

### \[v11.1.8]

* fixed notification issues

### \[v11.1.7]

* fixed ACL issues
* hotfix kafka partitioner, alarm prios

### \[v11.1.6]

* added filter to calculator (pre-release)
* hotfix delete listener

### \[v11.1.5]

* hotfix for valid flag
* hotfix alarm rules insertion

### \[v11.1.4]

* fixed privileges for schema "public"
* fixed upsert\_heap\_direct() for calculator
* Dashboard -> Widget -> Value variant Tiles -> show configured element descriptions
* hotfix output subtype

## 20231130 – Changelog \[v11.1.3]

We are pleased to present Eliona v11.1.3. With this hotfix, we have made Eliona a little better again and fixed various bugs.

We would like to present the most important changes to you here in detail.

> You can find the full changelog at the end of this post.

### We fixed the following bugs:

* A crash could occur if an asset attribute was selected in the calculator for which no translation was available. We fixed this bug.
* If an asset attribute was selected in the calculator for which no translation was available, the attribute class was displayed instead of the original attribute name (without translation). We fixed this bug. From now on, the original untranslated attribute name will be displayed in such cases.
* If asset attributes were displayed in a sidebar for which no translation was available, the attribute class was displayed instead of the original attribute name (without translation). We fixed this bug. From now on, the original untranslated attribute name will be displayed in such cases.
* We have ensured that bar charts are displayed correctly in widgets again.

### We introduced the following new features:

* Data retrieved via apiv2 can now be used in the calculator.

### Full changelog \[English]

<details>

<summary>Changelog v11.1.3</summary>

### \[v11.1.3] - 2023-11-27

#### Fixed 🐞

* Asset -> Details -> Prevent attribute calculator crash and show attribute name as fallback (BR-2208) \[@rtu]
* General -> Detailed Sidebar -> Show attribute name, not type, as fallback (BR-2259) \[@rtu]
* Widget/Smart Assist -> Trend Element -> Fix bar chart trends in bar variant (SB-07610/BR-2086) \[@rtu] Heap events with "source", older reporter patch amended, Azure setup cleaned up Database

### \[v11.1.3] - 2023-11-23

#### Changed

Heap events with "source", older reporter patch amended, Azure setup cleaned up \[@al] Apiv2

### \[v11.1.1] - 2023-11-28

#### Changed

Integrate Kafka for PUT /data \[@ag] Alarm-Check

### \[v11.1.2] - 2023-11-24

Fixed a bug causing alarm rules not to be updated in some cases \[@les]

</details>

### Report bugs

You can report bugs to us at any time using the following form:

{% embed url="<https://form.asana.com/?d=4655289679314&k=WtF5jUfVMiI3mLVGdN3FTg&origin=embed>" %}

## 20231107 – Changelog \[v11.1.2]

In this hotfix, we fixed a bug that could cause a crash when the "Niagara" app is configured.

## 20231106 – Changelog \[v11.1.1]

In this hotfix, we fixed a bug that could cause incorrect display in the asset list.

## 20231027 – Changelog \[v11.1.0]

We are pleased to present the latest version of eliona. We mainly used version 11.1.0 to make optimizations to ACL - our comprehensive new system for managing user permissions.

In addition, we made many small but fine improvements and introduced new features that will make using eliona even more pleasant.

We would like to present some of the changes we made in this release in a little more detail:

### New features

#### [-> Notifications](/collection/english-v14/documentation/benachrichtigungen.md):

Notifications for alarms can now be delivered with sound.

#### [-> ACL](#acl)

We have made eliona's internal logic with regard to ACL more transparent for users. Since the introduction of ACL, it can happen that users want to interact with assets for which they do not have permission, e.g. because access to a parent asset is missing. In these cases, the corresponding menu options are shown greyed out. If an attempt is nevertheless made to interact with an asset to which there is no access, an information message is displayed that clearly explains to the user why a desired action cannot be performed.

### Changes

#### [-> Alarms](/collection/english-v14/documentation/alarme-regeln-und-eskalationen/alarme.md)

The Alarms menu now opens by default in a compact view. This responds to a request from many users. The detailed view remains available, of course. As usual, you can switch between the two views using a toggle. As long as you are logged in, eliona remembers the last selected state.

#### [-> Analytics](/collection/english-v14/documentation/analytics-and-reports.md)

We have made Analytics even more detailed. From now on, in an Analytic you can now also define times in the time span for the start and end date, including times.

#### [-> Assets](/collection/english-v14/documentation/assets.md)

We have further optimized the asset creation process. From now on, you can assign tags directly when creating an asset.

#### Script Engine

The Script Engine is moving from the settings to the "Engineering" menu

### Fixed bugs

* Negative values could not be entered in Value Mapping. This bug has been fixed. From now on, it is possible to specify negative values in Value Mapping.
* Users could accidentally remove permissions for an asset from themselves by deleting the tags of this asset. This has been fixed.
* [-> Storeys](/collection/english-v14/documentation/karte-und-stockwerk/stockwerk.md): A bug was fixed that made it impossible to upload new floor plans.
* Widgets: A bug was fixed that caused incorrect display of alarms in the widget title bar.

This was just a small overview of the improvements we made for you. The full changelog, including all fixed bugs, can be found below.

<details>

<summary>Full changelog [v11.1.0]</summary>

## **Changed**

* Settings -> Scripts -> Moved to the Engineering section (SB-06945) \[@nl]
* Alarms -> Compact view, changed to detailed view and inverted behavior (SB-07251) \[@rtu]
* Analytics -> changed custom date range to support time ranges (SB-07185) \[@rtu]
* Smartview -> Updated browser title BR-2120 \[@nl]
* Asset -> List -> widen tag column width (SB-07184) \[@rtu]

## Added

* Users -> Add User dialog -> Error message when creating user with existing email of archived user (BR-1989) \[@rtu]
* Assets -> Add asset dialog -> Add new field with role tags selector, the same as on the detailed page of the asset (SB-06951) \[@jp]
* Apps -> Xovis -> Enhance configuration with advances and new optional fields (SB-06656) \[@rtu]
* Assets -> added tooltips that explain ACL restrictions BR-2050 \[@nl]
* General -> Go To Alarms shows all alarms include child asset alarms (SB-07238) \[@rtu]
* General -> Sound notifications about new alarms SB-07239 \[@nl]
* Settings -> Audit trail -> Enhance Audit trail with connection points (SB-07376) \[@rtu]

## Fixed

* Rules -> List -> Filter list by keyword (BR-2003) \[@rtu]
* My Profile -> My Profile page isn't available for users without Eliona.Users permissions (BR-2023) \[@nl]
* Engineering -> Escalation -> Add Target Dialog -> Impossible to close "Data isn't saved" warning dialog (BR-2018) \[@nl]
* Assets -> Archives asset's children only from the active tree (BR-2031) \[@nl]
* Tickets -> List -> showing archived references for main assets (BR-2027) \[@rtu]
* Apps -> Generic App Frontend -> prevent crash when app json config missed ref params (BR-1845) \[@rtu]
* Widgets -> General Header -> show highest prio of primary asset alarms and use colorblind friendly icons (BR-2033) \[@rtu]
* Widgets -> Link & Storey -> fix weird behaviors when using elements in custom widgets (BR-1954) \[@rtu]
* Widget -> Ticket -> Fix ticket count (BR-2043) \[@rtu]
* General -> Asset Attributes -> remove capitalizing of asset attributes (BR-2020) \[@rtu]
* General -> Folder Tables -> fix crashing of page when sorting for entries that don't have a name (BR-2036) \[@rtu]
* Digital Twin -> show go to alarms link & update changing output values in sidebar (BR-2037, BR-2038) \[@rtu]
* Widget -> Input -> Select -> fixed inability to set new value if value is null
* Assets -> possibility to archive assets in func tree if it's forbidden in the loc tree and vice versa BR-2050 \[@nl]
* Alarms -> Go to Rules doesn't work correctly BR-2088 \[@nl]
* Engineering -> Asset Modeling -> Attribute config -> Value mapping accepts negative numbers BR-2085 \[@nl]
* Engineering -> Notification Providers -> Templates -> disable save button for empty templates (BR-2102) \[@rtu]
* Analytics & Reports -> Reports -> fix date time input validation (BR-2057) \[@rtu]
* Digital Twin -> Links -> allow configuring attributes of all subtypes (BR-2043) \[@rtu]
* Tickets -> List -> fix toolbar filter count for open & closed tickets (BR-2080) \[rtu]
* Tickets -> Detail -> fix sorting of tasks by their asset name (BR-2083) \[@rtu]
* Assets management, Tags management -> a user can't save an asset with a list of tags that will forbid the user access to this asset BR-2059 \[@nl]
* Widgets -> Trend -> prevent tooltip from overlapping charts BR-2096 \[@nl]
* Smartview -> Storey widget -> Label of the archived asset isn't displayed in the widget form BR-2119 \[@nl]
* Assets -> Asset Data -> Useless comma removed from the table BR-2121 \[@nl]
* General -> Dashboard/Smartview Table element -> show datapoint description in variant "multiple" (BR-2066) \[@rtu]
* Map -> Placement -> Storey -> layout image updating doesn't work properly BR-2129 \[@nl]
* Assets -> Create/Edit asset -> The form saves asset changes even if there is a conflict error caused by associated ids BR-2100 \[@nl]
* Alarms -> Statistic -> change weekly alarm chart to support 8 days (BR-1928) \[@rtu]

</details>

## 20230925 - Changelog \[v11.0.0]

<details>

<summary>Overview</summary>

**Added** 🚀

* Roles -> ACL function for managing individual roles
* PKI/SSL -> page added for managing certificates
* General -> archived references to assets and users on all entities

**Fixed bugs** ![:marienkäfer\_1:](https://a.slack-edge.com/production-standard-emoji-assets/14.0/apple-medium/1f41e.png)

* Settings -> Apps -> missing error snackbar added in the generic app frontend
* General -> redirect after login fixed to preserve search parameters
* Floor -> bug fix for polygon and Pio Value Mapping colors
* Map -> Asset Detail -> "Go to floor" link fixed
* App Topbar -> Project Logo -> issue with blinking images fixed
* Project Details -> Project Logo -> issue fixed where the image was not displayed
* Widgets -> Input Widget -> It is now no longer possible to select attributes without the "Output" subtype in the "Setpoint" field of the Input Widget form
* Settings -> System -> the eliona logo is now used as the default system logo

</details>

We are pleased to introduce you to the latest version of eliona!

With this version we are introducing a remarkable new feature – the **Access Control List (ACL)**

ACL revolutionizes the assignment of access rights in eliona.

ACL allows administrators and system owners to finely adjust users' rights. It is now possible to grant or deny users read and write access to every function of eliona. Parts of eliona can even be completely hidden from certain users. This enables distraction-free work and maximum discretion.

At the same time, ACL enables the management of user groups.

Apart from ACL, there are the following other new features:

* [SSL](#ssl)
* [References to archived assets](#verweise-auf-archivierte-entitaeten)

### ACL

<figure><img src="https://content.gitbook.com/content/Nyvwhz1kEMXcHf4HLuZ8/blobs/ASFpITQEpbm2SfJpJcSf/A7A74911-AC09-459C-884A-96FA8993E53A.png" alt=""><figcaption><p>Insight into a role</p></figcaption></figure>

#### How does ACL work?

Access rights are controlled via so-called "roles". You create a role and configure read permissions and write permissions in that role. You then assign this role to one or more users. Users with this role may then only perform actions that the role allows them to perform. By assigning a role to multiple users, you can quickly and easily create user groups in this way.

#### Read permission and write permission

You can define read permissions and write permissions for each individual role.

**Read permission**

If read permission has been granted, users can see entries and menu items, but not change them.

If no read permission has been granted, users CANNOT see entries.

By not granting read permissions, you can completely hide individual menu items from users.

**Write permission**

If write permission has been granted, a user can enter values, delete objects, and create new ones.

#### System roles vs project roles

There are 2 types of roles: project roles and system roles. It is important to understand the difference between project roles and system roles.

**System roles**

The settings in system roles control permissions for options that apply across the entire system. The options controlled by this role remain the same in all projects.

**Project roles**

Project roles apply per project and control project-specific permissions, e.g. access to certain assets.

#### User groups

One advantage of our role-based rights system is the ability to create user groups. All members of this user group then have the same rights.

Simply assign a role to multiple users to equip several users with the same rights.

In our [documentation](/collection/english-v14/documentation/rollen.md) we have described in detail how you can use this feature!

### Private Access Key

We have added a dedicated page where you can manage certificates.

<figure><img src="https://content.gitbook.com/content/Nyvwhz1kEMXcHf4HLuZ8/blobs/wfxSry6qyNvpLWhlUeaW/PKI%20.png" alt=""><figcaption><p>Distribute certificates</p></figcaption></figure>

You can find the page under *Connection -> PKI -> Certificates*

### References to archived entities

We have changed how eliona displays references to archived entities (e.g. assets or users).

Previously, eliona behaved as follows: if, for example, a ticket referred to an archived entity (e.g. an asset or a user), the name of the archived entity was not displayed.

<figure><img src="https://content.gitbook.com/content/Nyvwhz1kEMXcHf4HLuZ8/blobs/7tz03dQK7wSY0vseuDZ5/D8903D32-BC73-4184-8350-8B452AEBFC2A.png" alt=""><figcaption><p>References to deleted entities used to be displayed like this.</p></figcaption></figure>

From now on, eliona displays the names of archived entities. In addition, archived entities are identified as such by a symbol.

<figure><img src="https://content.gitbook.com/content/Nyvwhz1kEMXcHf4HLuZ8/blobs/52tlP5MHJsMCQdbRgI1J/EB0F10F3-EE73-4E51-AFF2-07949F4DF7D5.png" alt=""><figcaption><p>From now on, archived entities are displayed with their names</p></figcaption></figure>

Don't forget that you can reactivate archived entities at any time!


---

# Agent Instructions
This documentation is published with GitBook. GitBook is the documentation platform designed so that both humans and AI agents can read, navigate, and reason over technical content effectively. Learn more at gitbook.com.

## Querying This Documentation
If you need additional information that is not directly available in this page, you can query the documentation dynamically by asking a question.

Perform an HTTP GET request on the current page URL with the `ask` query parameter, and the optional `goal` query parameter:

```
GET https://docs.buildings.ability.abb/collection/english-v14/new-features/changelog-aktuelle-version-v14.2.5.md?ask=<question>&goal=<endgoal>
```

`ask` is the immediate question: it should be specific, self-contained, and written in natural language.
`goal` is optional and describes the broader end goal you are ultimately trying to accomplish on behalf of the user. GitBook uses it to tailor the answer towards what is most useful for that goal.

The response will contain a direct answer to the question and relevant excerpts and sources from the documentation.

Use this mechanism when the answer is not explicitly present in the current page, you need clarification or additional context, or you want to retrieve related documentation sections.