> For the complete documentation index, see [llms.txt](https://docs.buildings.ability.abb/collection/llms.txt). Markdown versions of documentation pages are available by appending `.md` to page URLs; this page is available as [Markdown](https://docs.buildings.ability.abb/collection/for-developers/monitoring-with-grafana.md).
# Monitoring with Grafana
## What is Grafana?
The central function of Grafana is the visualization of data. Grafana is often used for monitoring applications and supports the three pillars of observability: metrics, logging, and tracing, but can also be used to display static data in relational databases.
The recorded raw data can be assembled into so-called [dashboards](/collection/platform/live-cockpit.md).
## Open Grafana
In the title bar, click on the "Monitoring" item.
## Grafana Dashboards
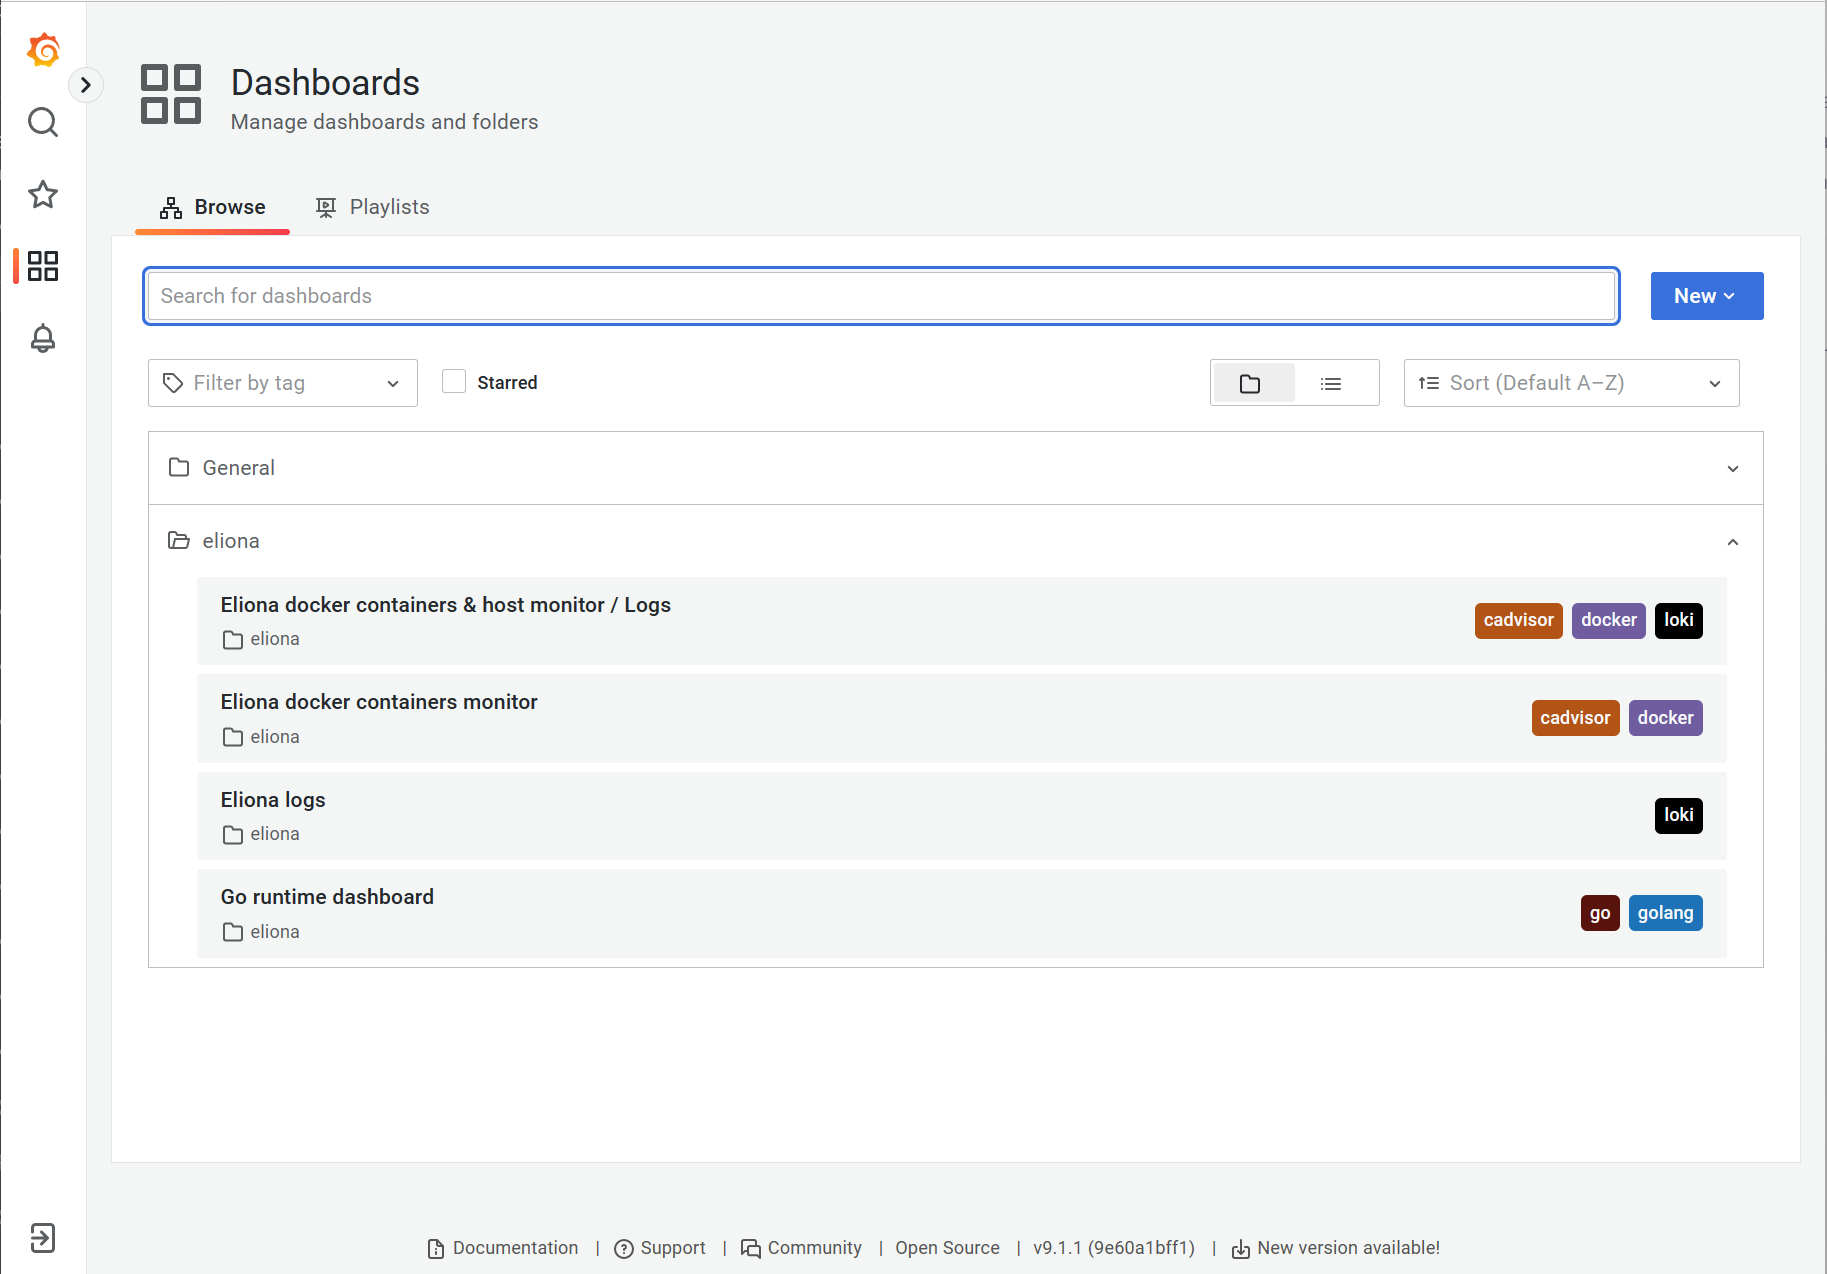
The following dashboards have been prepared for BuildingPro Suites with Grafana:
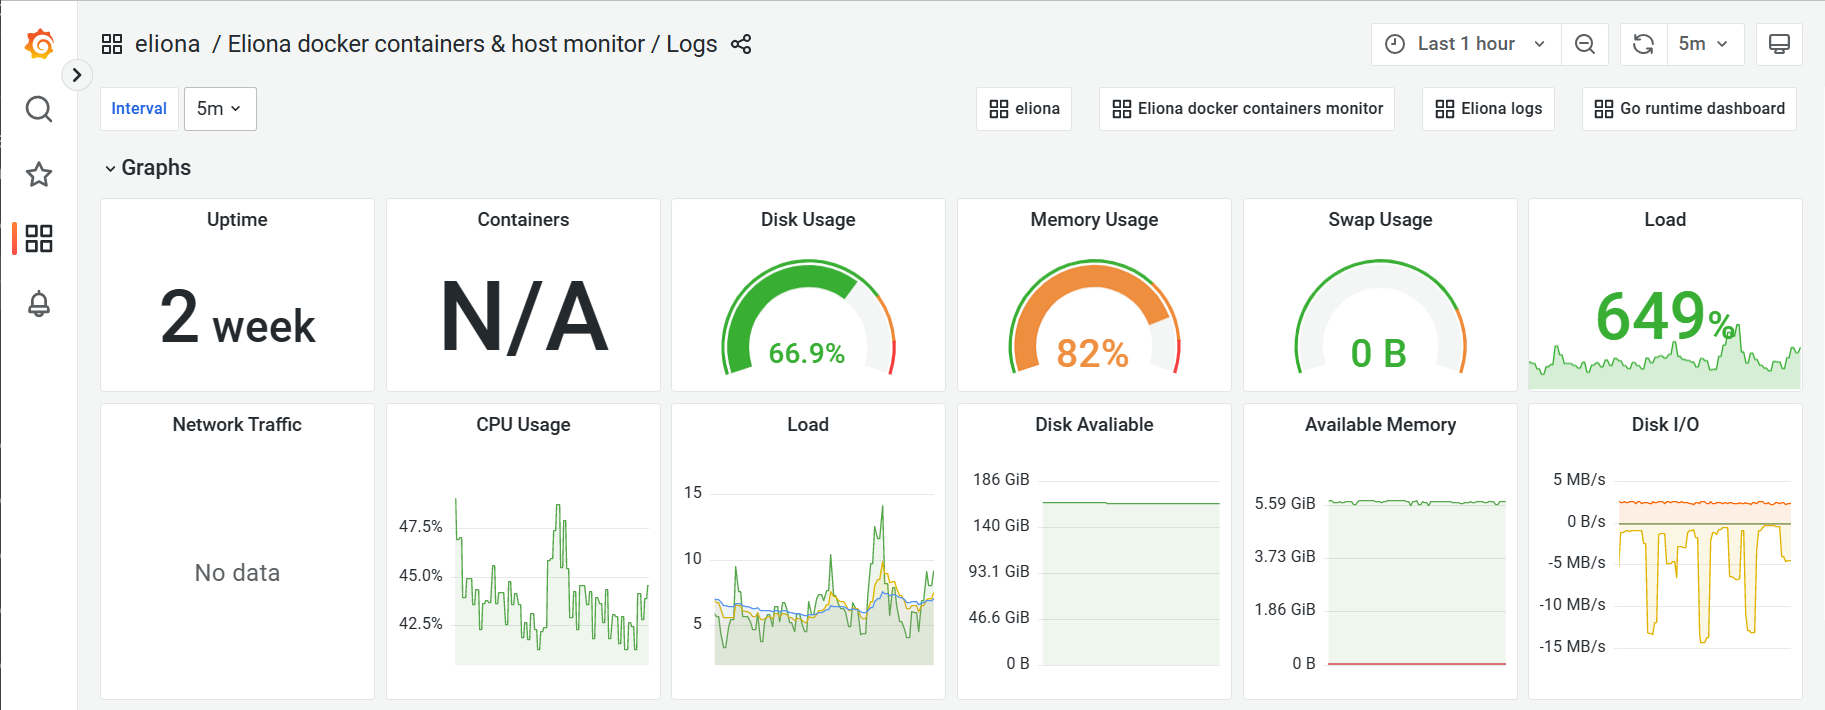
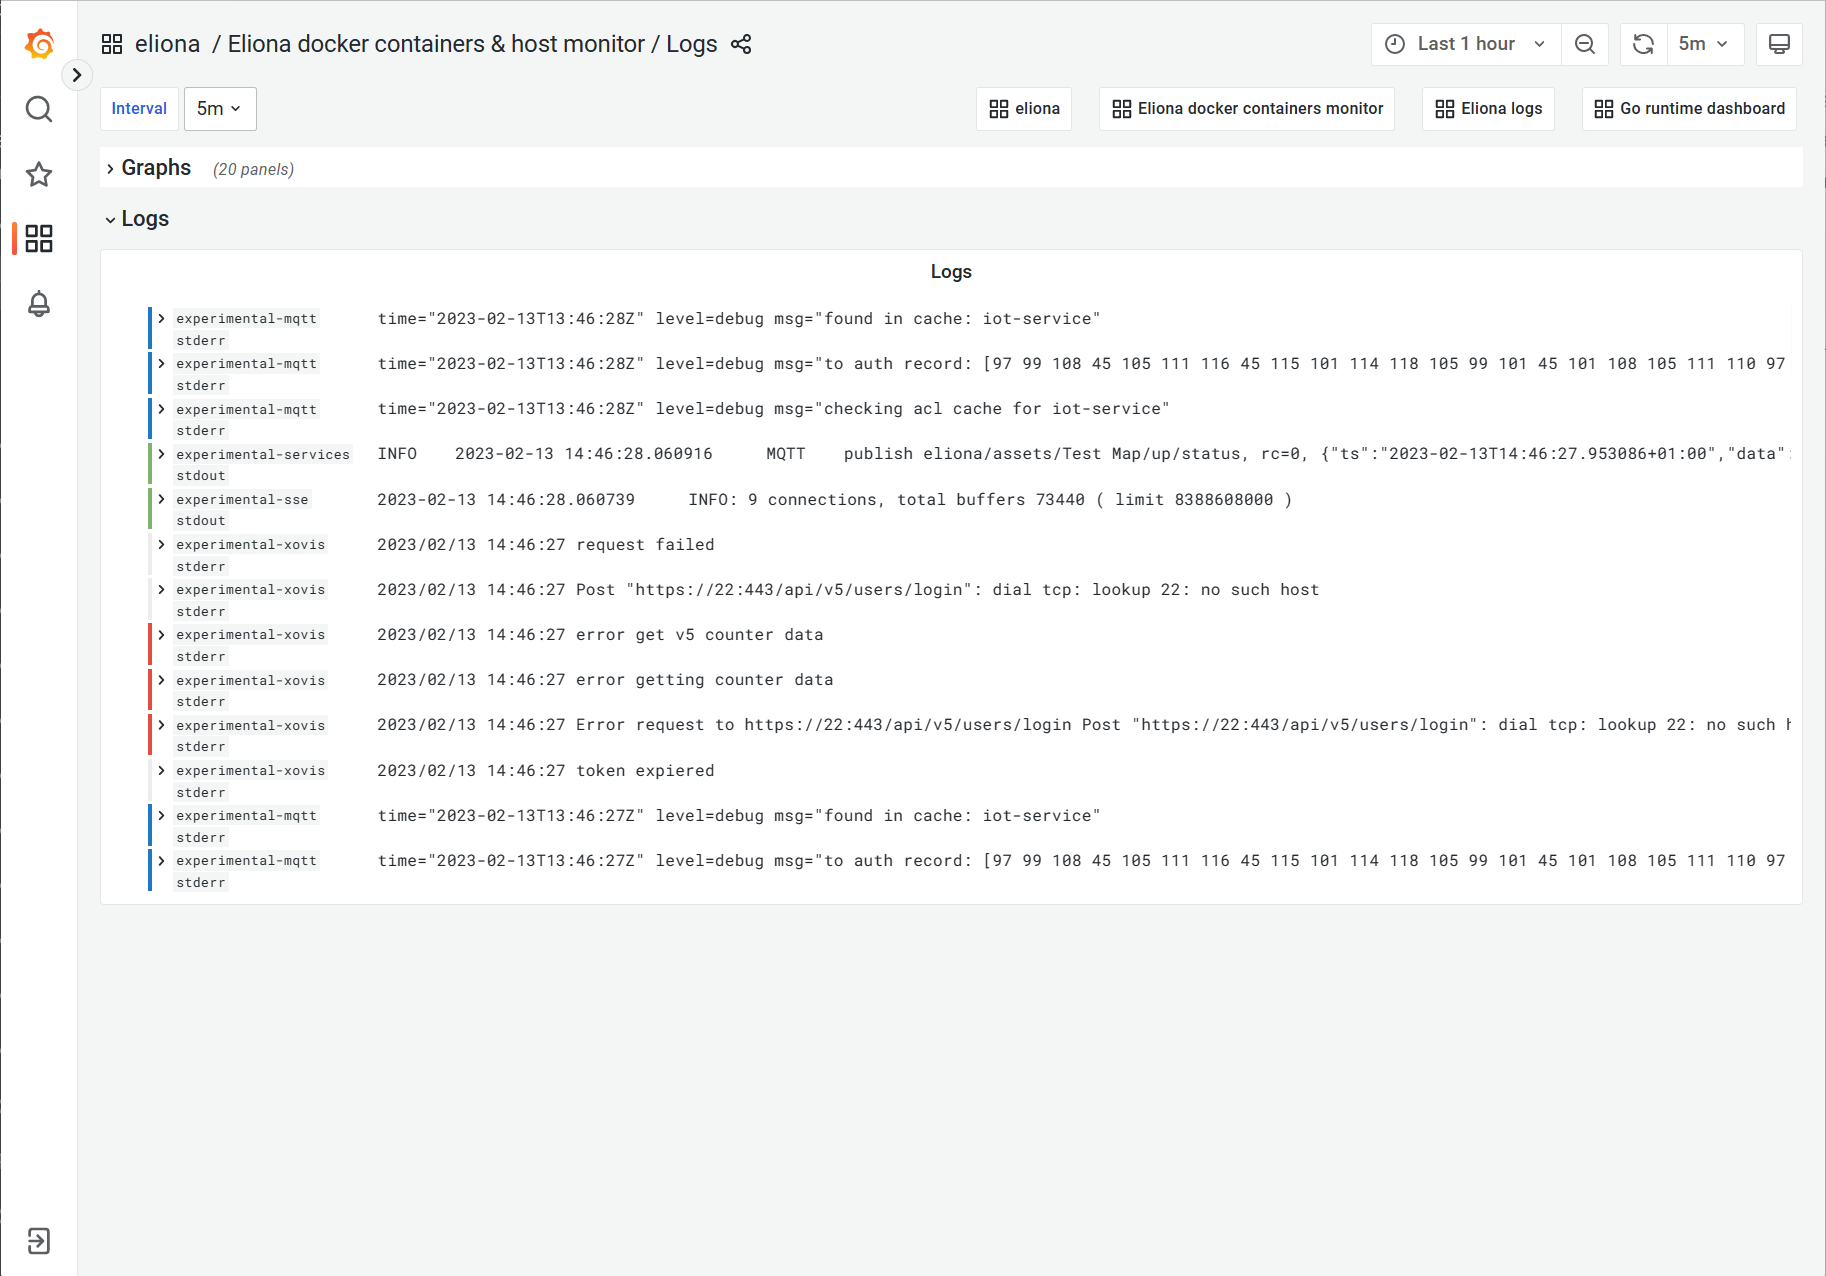
* **BuildingPro Suites docker container & host monitor / Logs**: Basic metrics (RAM, CPU, Net) of the host and the BuildingPro Suites containers, as well as log protocols.
* **BuildingPro Suites docker container & host monitor:** Basic metrics (RAM, CPU, Net) of the BuildingPro Suites containers.
* **BuildingPro Suites logs:** BuildingPro Suites logs with filters
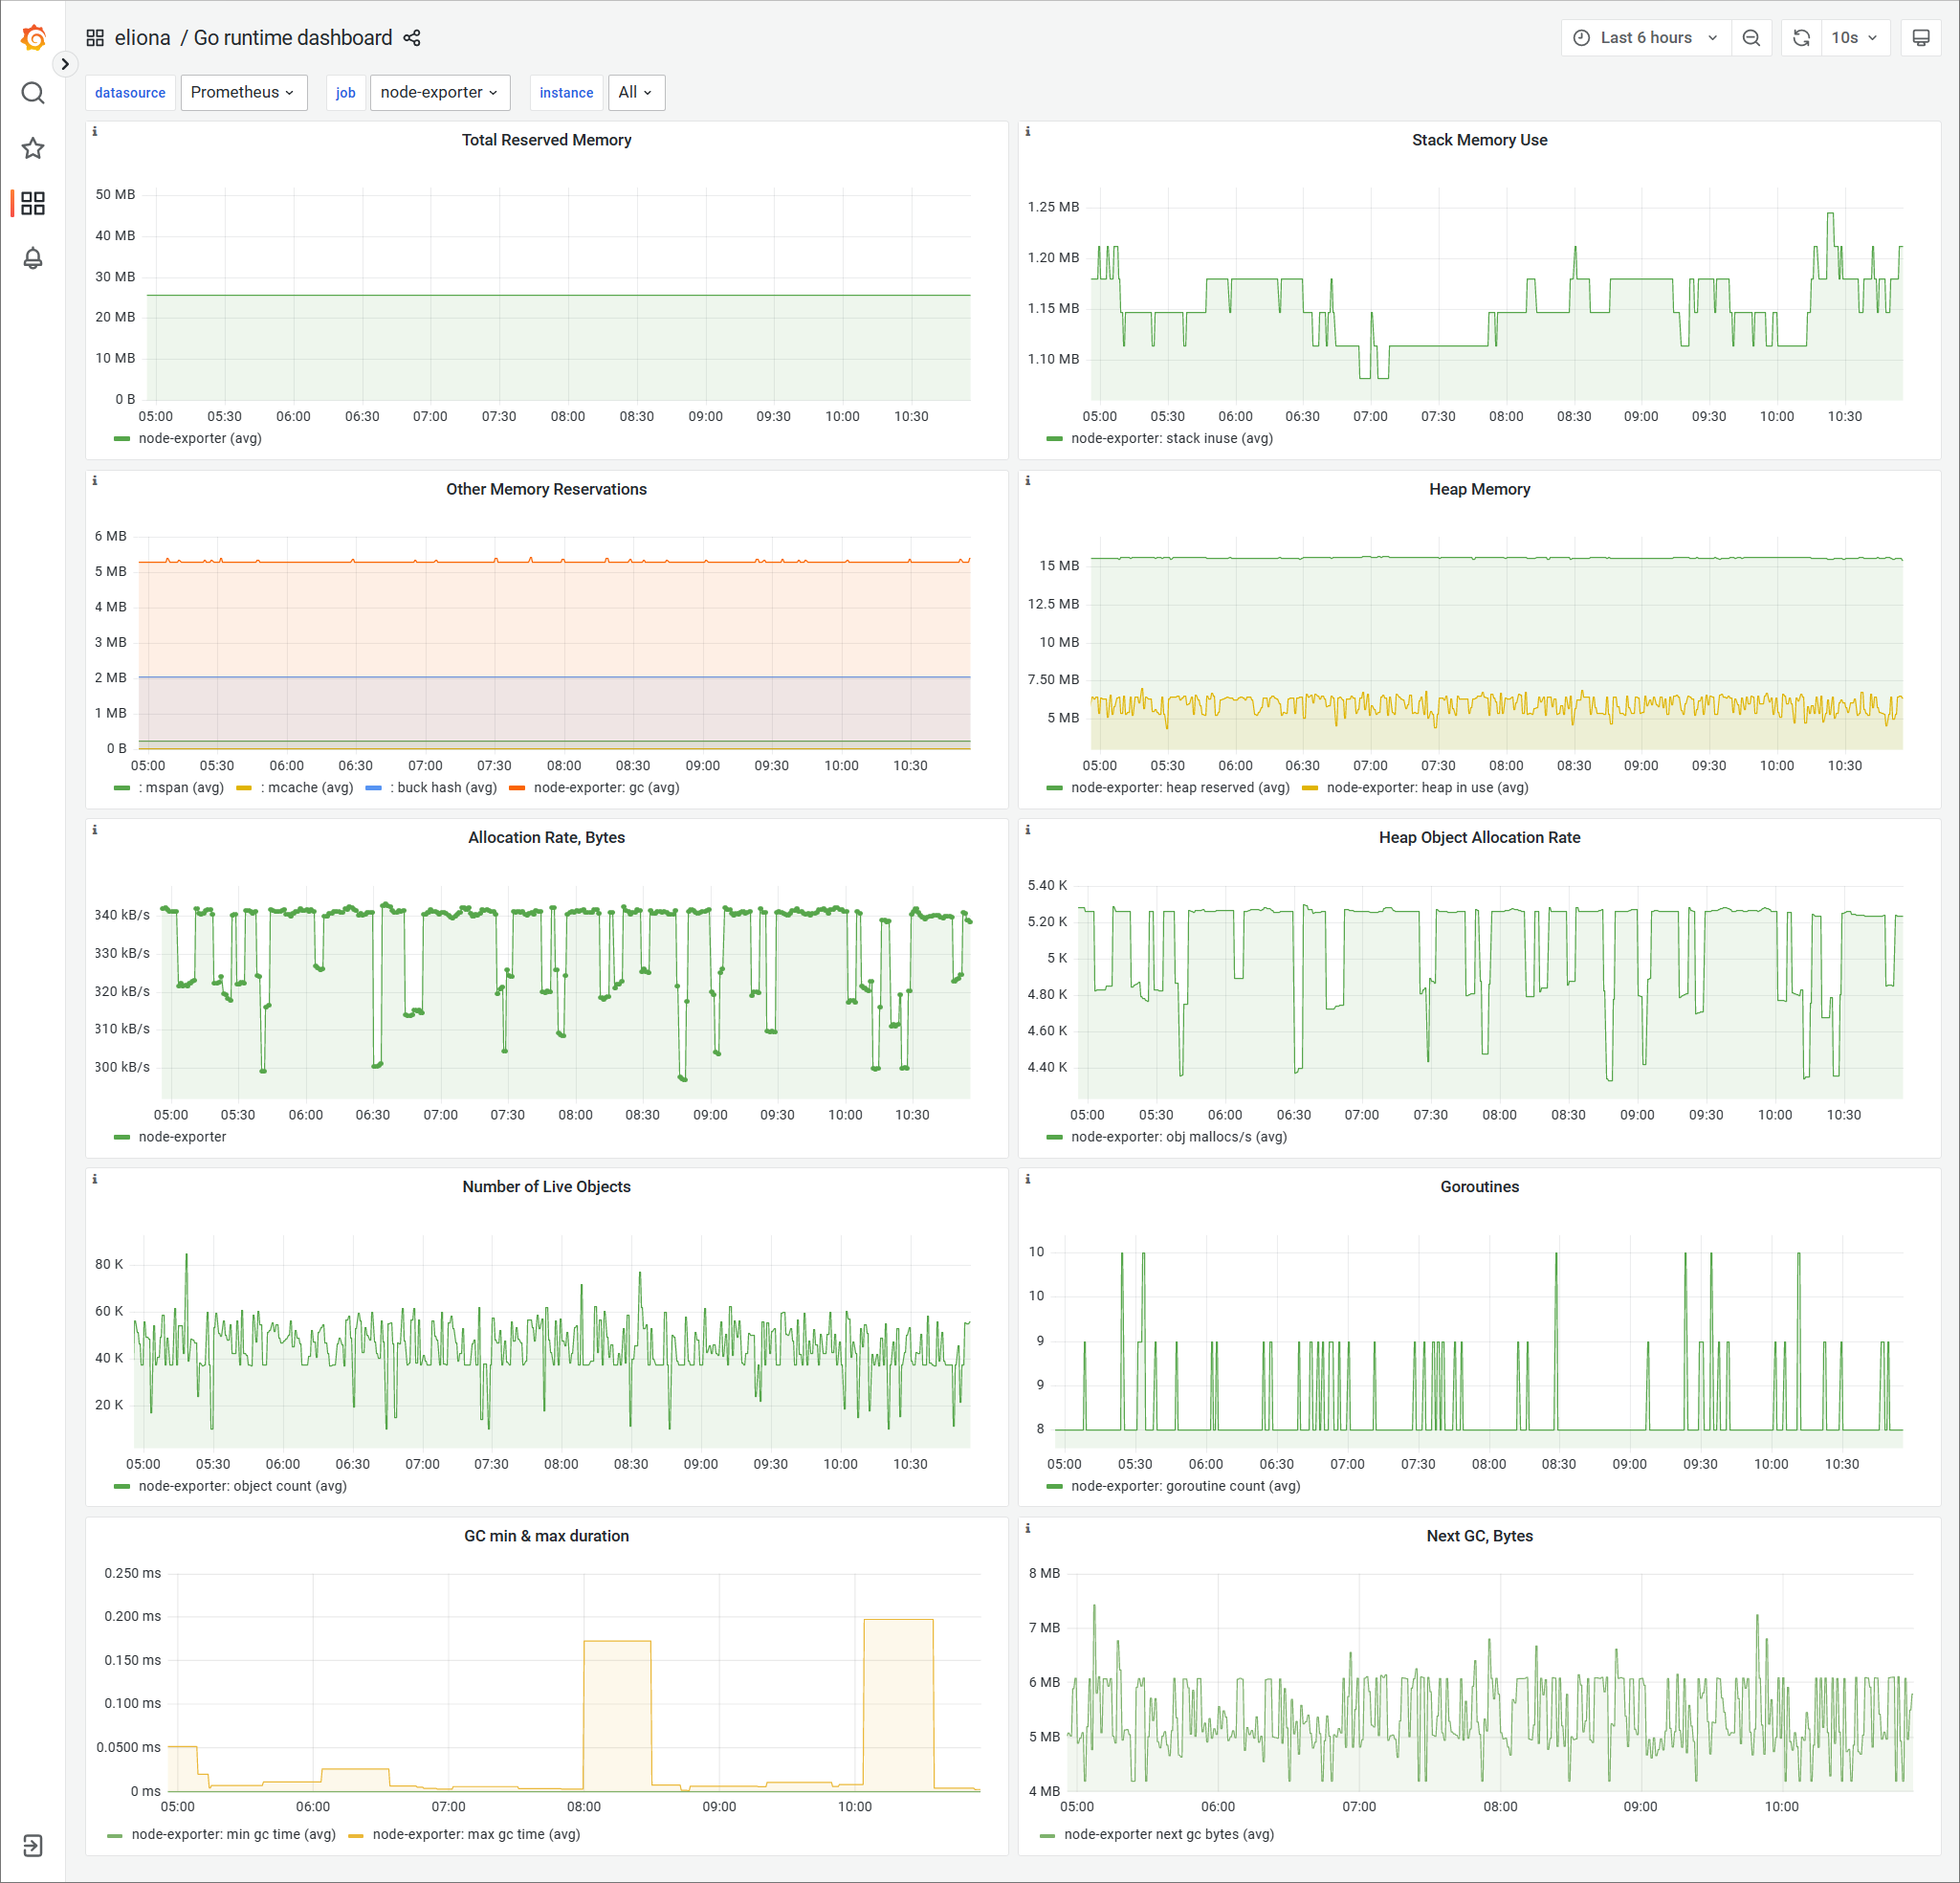
* **Go runtime dashboard:** Metrics of the Go parts of BuildingPro Suites (services that were developed with Golang)
---
# Agent Instructions
This documentation is published with GitBook. GitBook is the documentation platform designed so that both humans and AI agents can read, navigate, and reason over technical content effectively. Learn more at gitbook.com.
## Querying This Documentation
If you need additional information that is not directly available in this page, you can query the documentation dynamically by asking a question.
Perform an HTTP GET request on the current page URL with the `ask` query parameter, and the optional `goal` query parameter:
```
GET https://docs.buildings.ability.abb/collection/for-developers/monitoring-with-grafana.md?ask=&goal=
```
`ask` is the immediate question: it should be specific, self-contained, and written in natural language.
`goal` is optional and describes the broader end goal you are ultimately trying to accomplish on behalf of the user. GitBook uses it to tailor the answer towards what is most useful for that goal.
The response will contain a direct answer to the question and relevant excerpts and sources from the documentation.
Use this mechanism when the answer is not explicitly present in the current page, you need clarification or additional context, or you want to retrieve related documentation sections.