> For the complete documentation index, see [llms.txt](https://docs.buildings.ability.abb/collection/llms.txt). Markdown versions of documentation pages are available by appending `.md` to page URLs; this page is available as [Markdown](https://docs.buildings.ability.abb/collection/german-14.2-freezed/dokumentation/widgets/vordefinierte-widgets/radar-diagramm.md).
# Radar-Diagramm
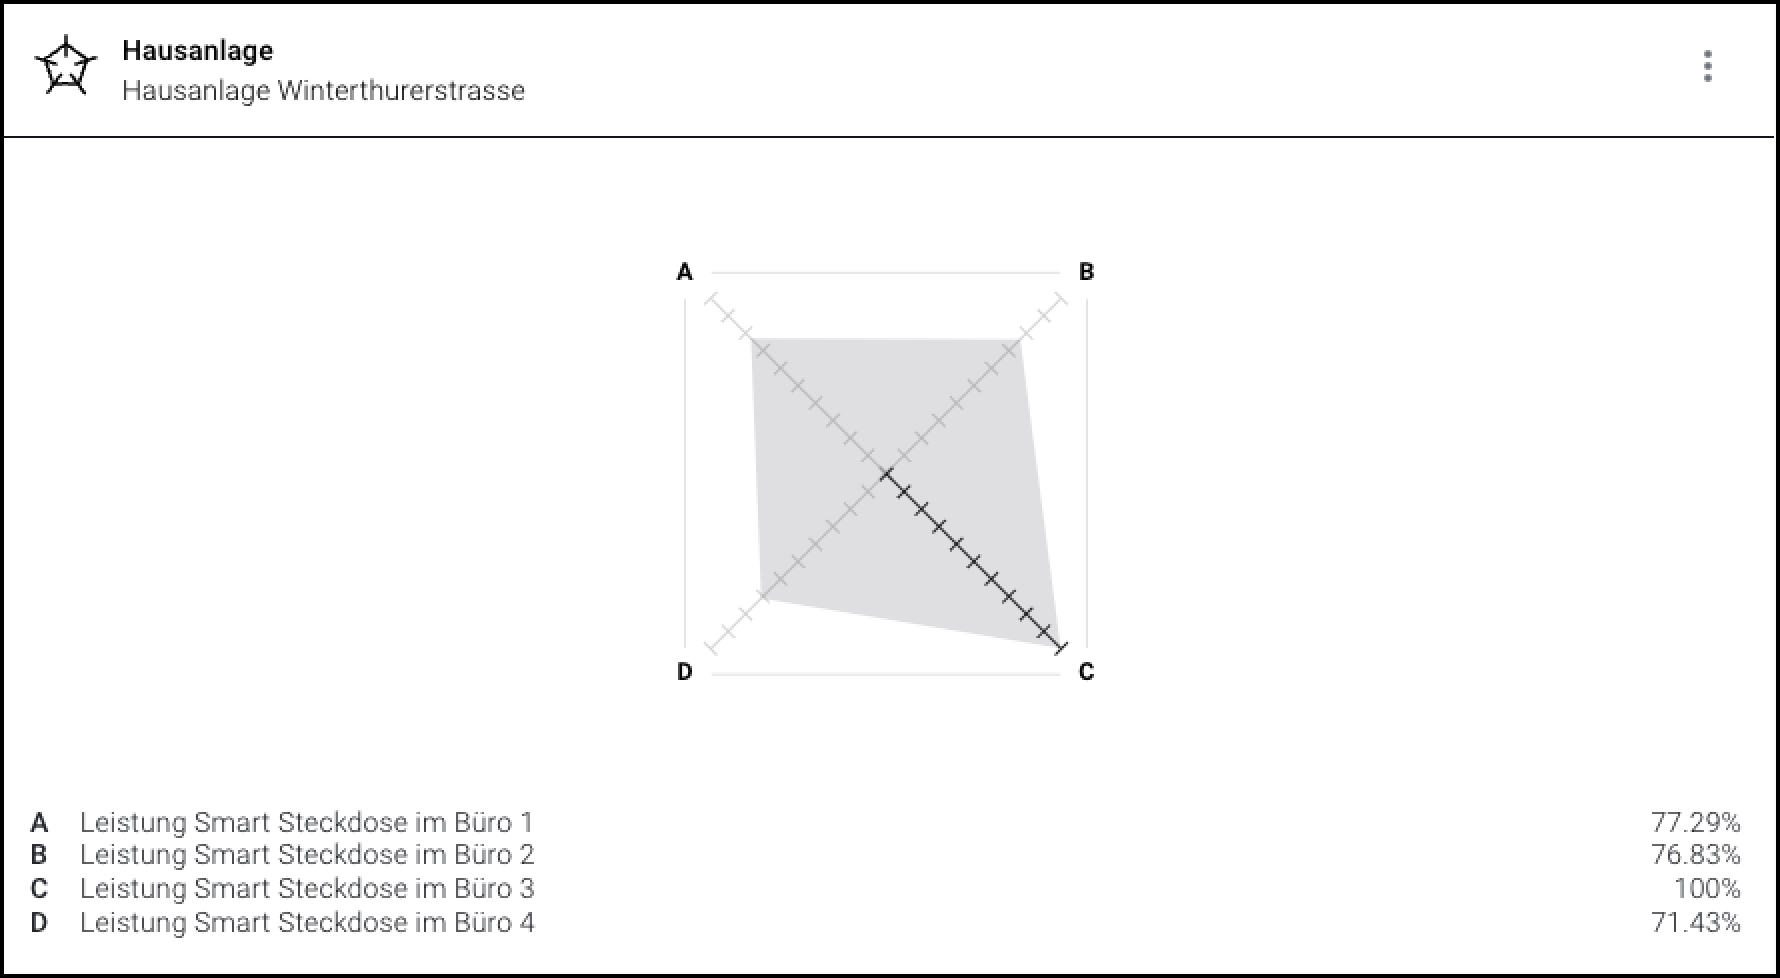
Radar-Diagramme zeigen Variablen auf 3 oder mehreren Achsen an.
Ein Radar-Diagramm mit 4 Variablen.
## Wann sollte diese Darstellung genutzt werden?
Radar-Diagramme sind sehr gut geeignet, um viele verschiedene Werte zu vergleichen und Ähnlichkeiten, Unterschiede aber auch Ausreisser darstellen zu können.
## Widget konfigurieren
{% @supademo/embed url="" demoId="lvwPfGWt45HMsHg1Tl9PW" fullWidth="true" %}
1. Vergewissern Sie sich, dass Sie sich im Menü "Dashboard" befinden
2. Klicken Sie auf "Widget hinzufügen"
3. Klicken Sie auf "View"
4. Klicken Sie auf "Radar-Diagramm"
5. Wählen Sie das Primäre Asset. Der Name dieses Assets wird in der Titelzeile des Widgets erscheinen.
6. Wählen Sie ein Asset, das als Quelle agieren soll.
7. Wählen Sie das Attribut der Quelle.
8. Wählen Sie, ob der Aktuelle Wert oder der Aggregierte Wert für Berechnungen genutzt werden soll.
9. Optional: Wiederholen Sie die letzten Schritte, um eine weitere Quelle zu erstellen.
10. Wählen Sie ein Asset, das als Senke agieren soll. Eine Senke kann z.B. ein Verbraucher sein.
11. Wählen Sie das Attribut der Senke.
12. Wählen Sie, ob der Aktuelle Wert oder der Aggregierte Wert für Berechnungen genutzt werden soll.
13. Optional: Wiederholen Sie die letzten Schritte, um eine weitere Senken zu erstellen.
14. Optional: Wählen Sie, wie viel Raum Ihr neues Widget auf dem Dashboard einnehmen soll.
15. Klicken Sie auf "Widget hinzufügen"
### Reihenfolge der dargestellten Assets verändern
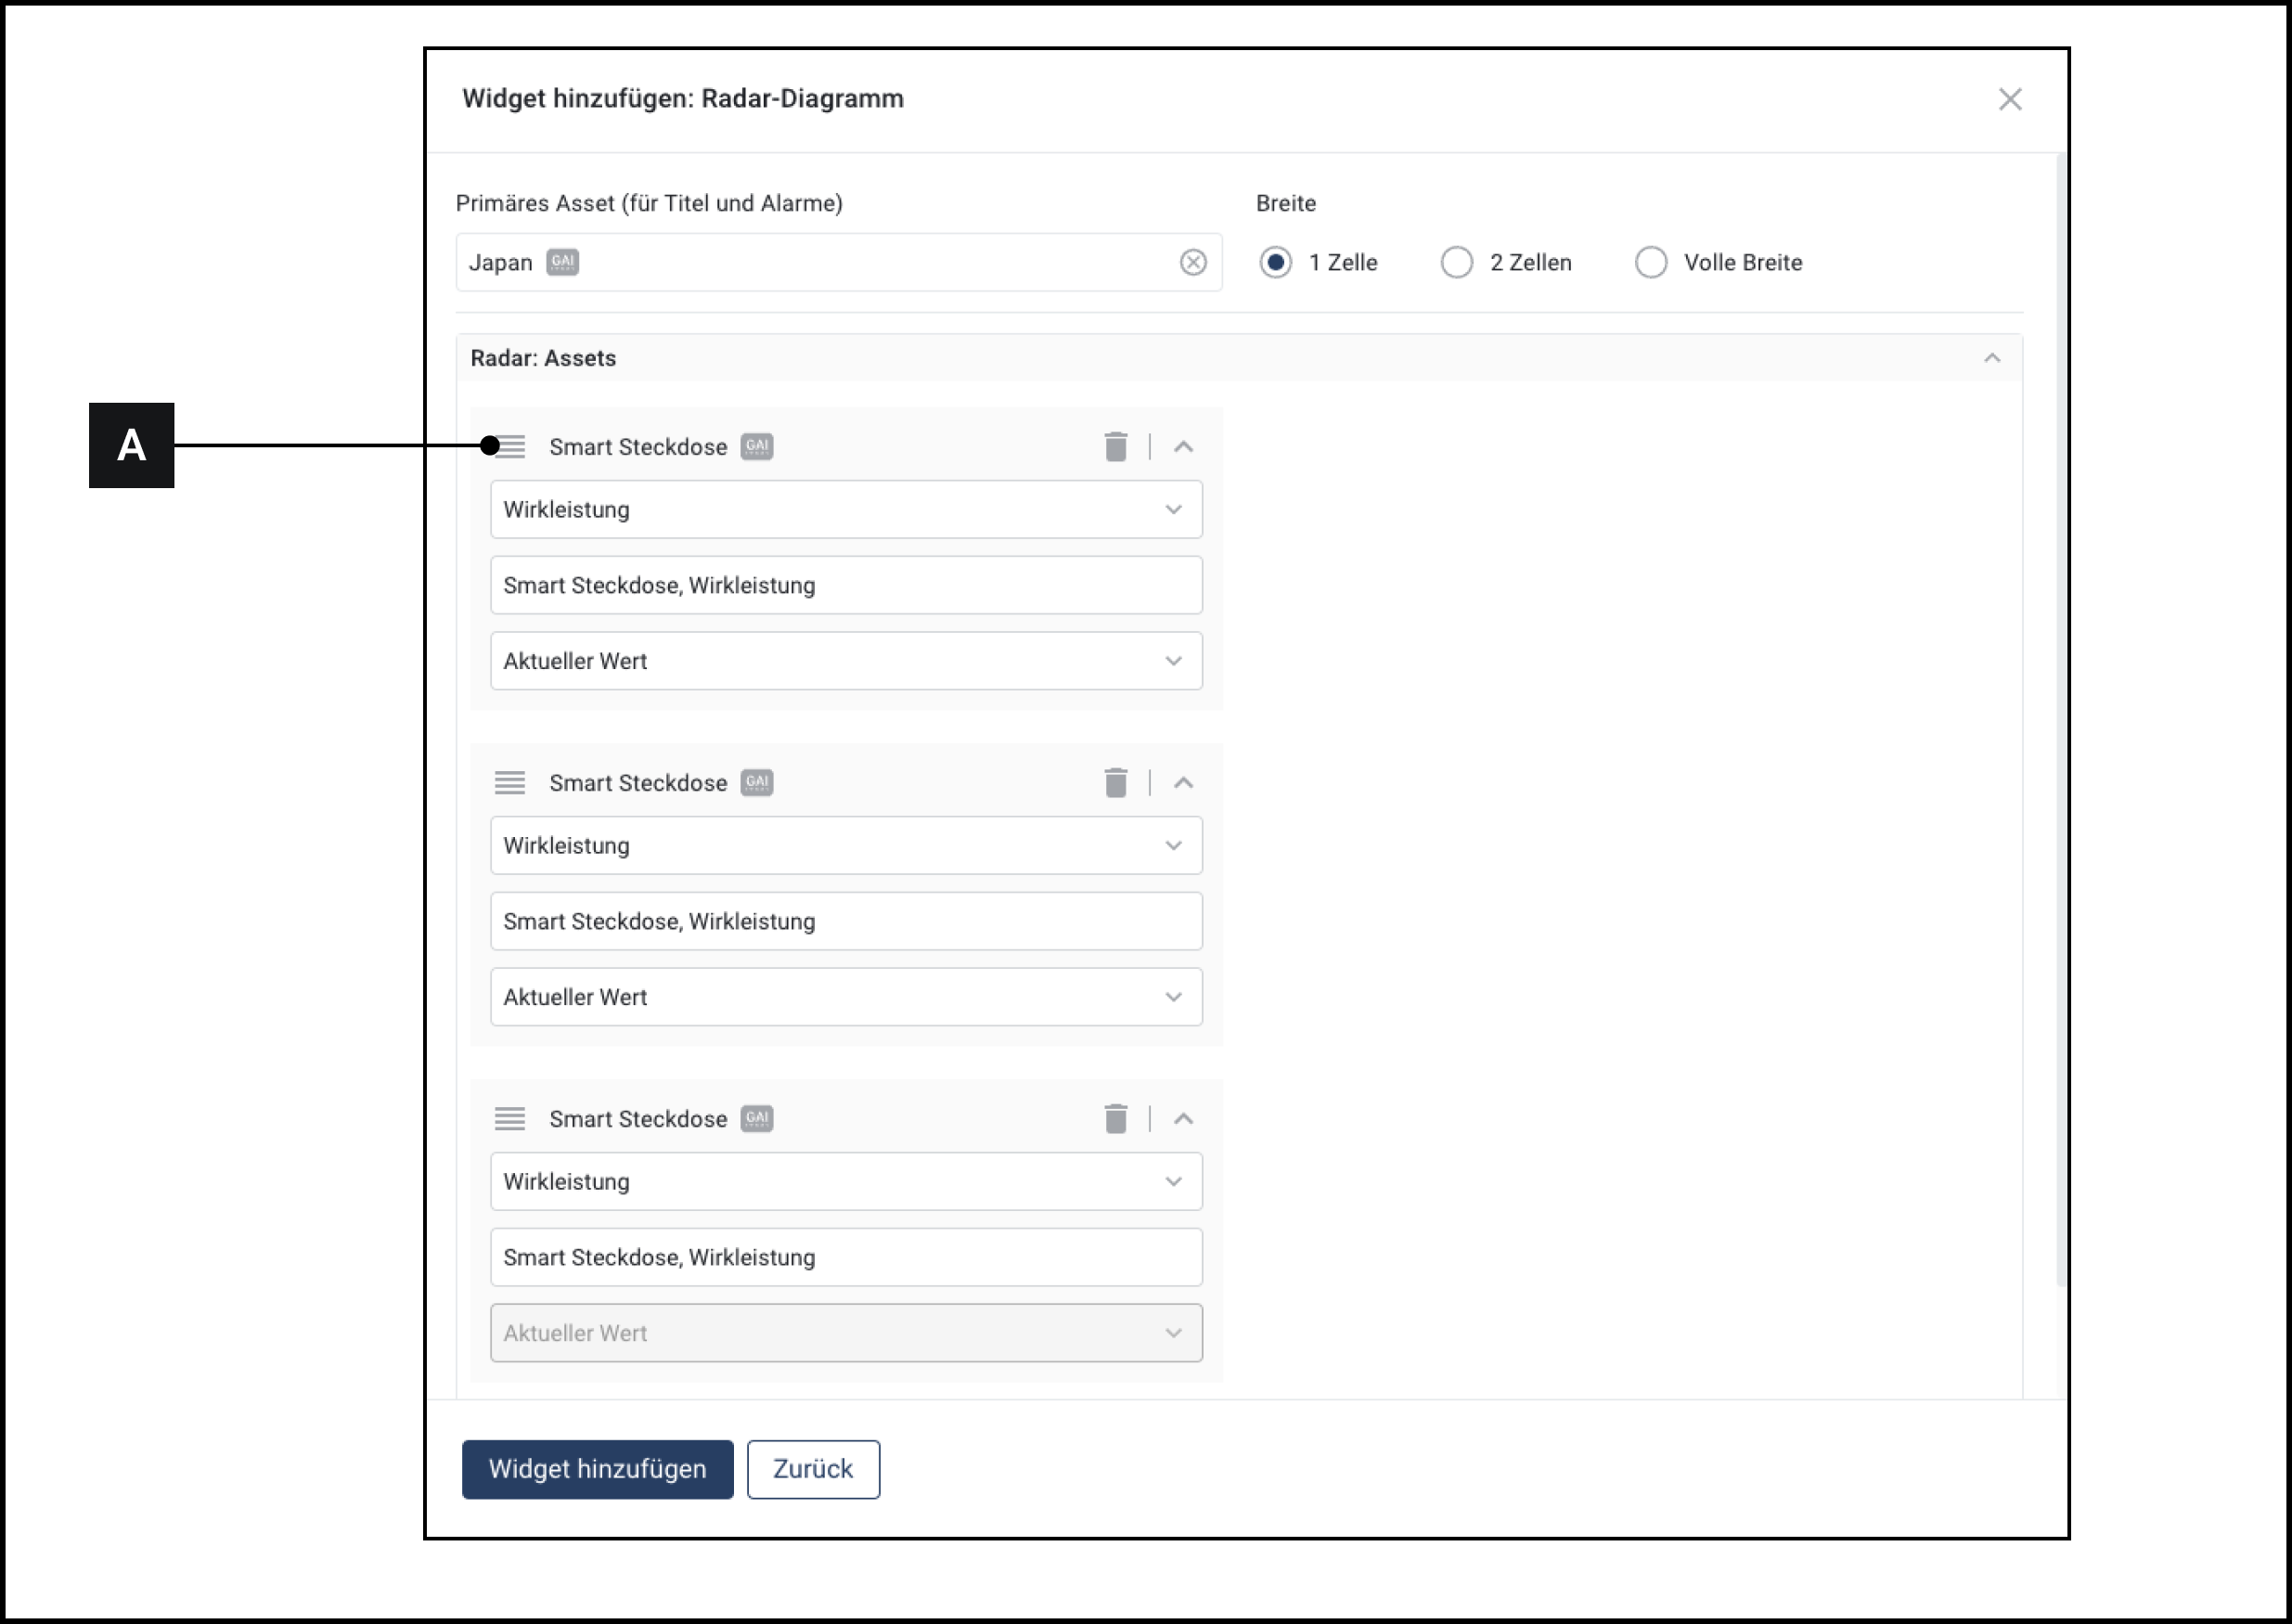
Sie können anpassen, in welcher Reihenfolge die Assets im Donut-Diagramm angezeigt werden.
Bei der Erstellung von Assets: Ziehen Sie mit **\[A]** die einzelnen mit Assets per Drag and Drop in die gewünschte Reihenfolge.
Sie können diese Einstellungen auch nachträglich vornehmen, indem Sie die Option [-> Widget bearbeiten](/collection/german-14.2-freezed/dokumentation/widgets/widgets-bedienen.md#widget-optionen) nutzen.
---
# Agent Instructions
This documentation is published with GitBook. GitBook is the documentation platform designed so that both humans and AI agents can read, navigate, and reason over technical content effectively. Learn more at gitbook.com.
## Querying This Documentation
If you need additional information that is not directly available in this page, you can query the documentation dynamically by asking a question.
Perform an HTTP GET request on the current page URL with the `ask` query parameter, and the optional `goal` query parameter:
```
GET https://docs.buildings.ability.abb/collection/german-14.2-freezed/dokumentation/widgets/vordefinierte-widgets/radar-diagramm.md?ask=&goal=
```
`ask` is the immediate question: it should be specific, self-contained, and written in natural language.
`goal` is optional and describes the broader end goal you are ultimately trying to accomplish on behalf of the user. GitBook uses it to tailor the answer towards what is most useful for that goal.
The response will contain a direct answer to the question and relevant excerpts and sources from the documentation.
Use this mechanism when the answer is not explicitly present in the current page, you need clarification or additional context, or you want to retrieve related documentation sections.