# Überwachung mit Grafana
## Was ist Grafana?
Die zentrale Funktion von Grafana ist die Visualisierung von Daten. Grafana wird häufig zur Überwachung von Anwendungen verwendet und unterstützt die drei Säulen der Observability: Metriken, Logging und Tracing, kann aber auch verwendet werden, um statische Daten in relationalen Datenbanken anzuzeigen.
Die erfassten Rohdaten können zu sogenannten [Dashboards](/collection/german/plattform/live-cockpit.md).
## Grafana öffnen
Klicken Sie in der Titelleiste auf den Eintrag "Monitoring".
## Grafana-Dashboards
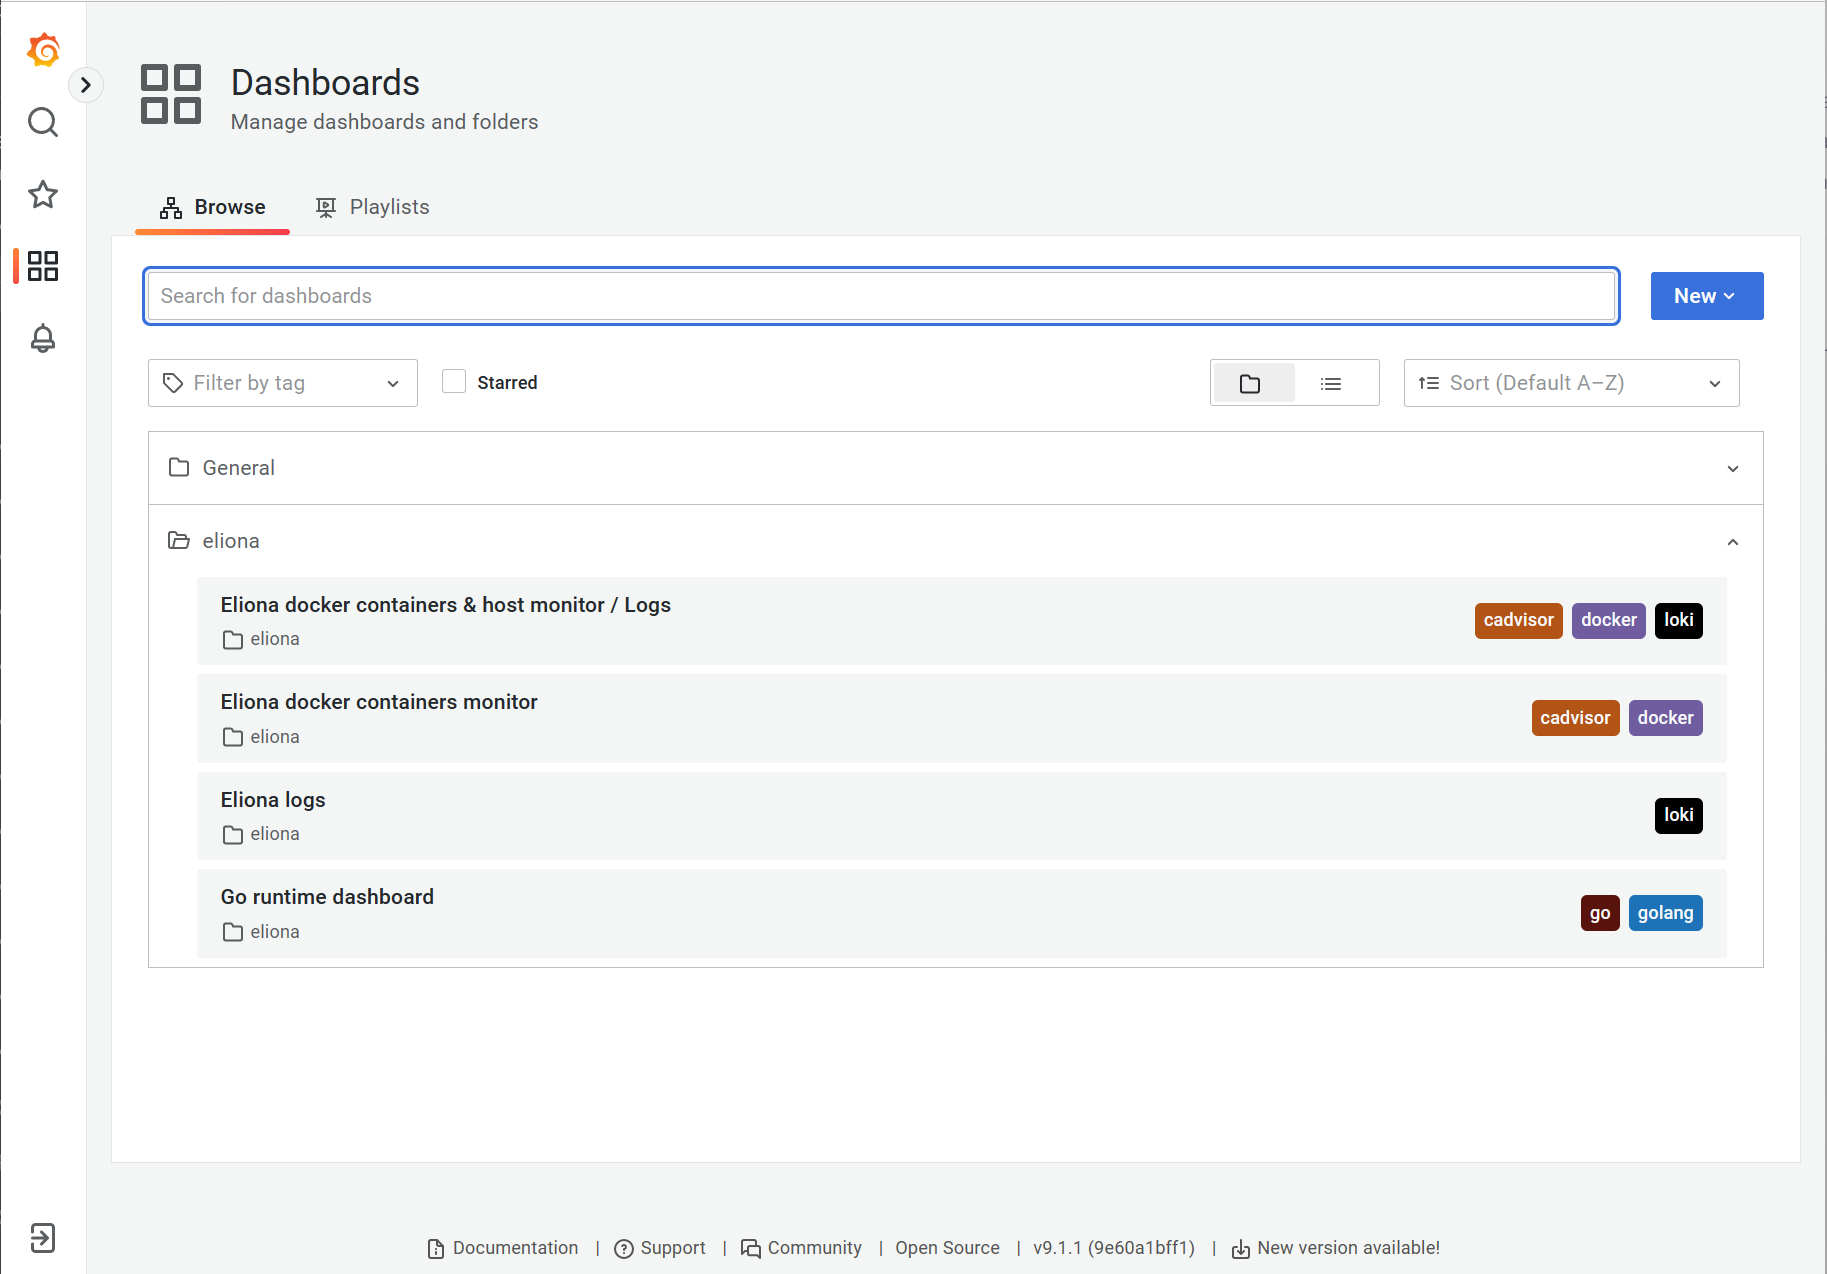
Die folgenden Dashboards wurden für BuildingPro Suites mit Grafana vorbereitet:
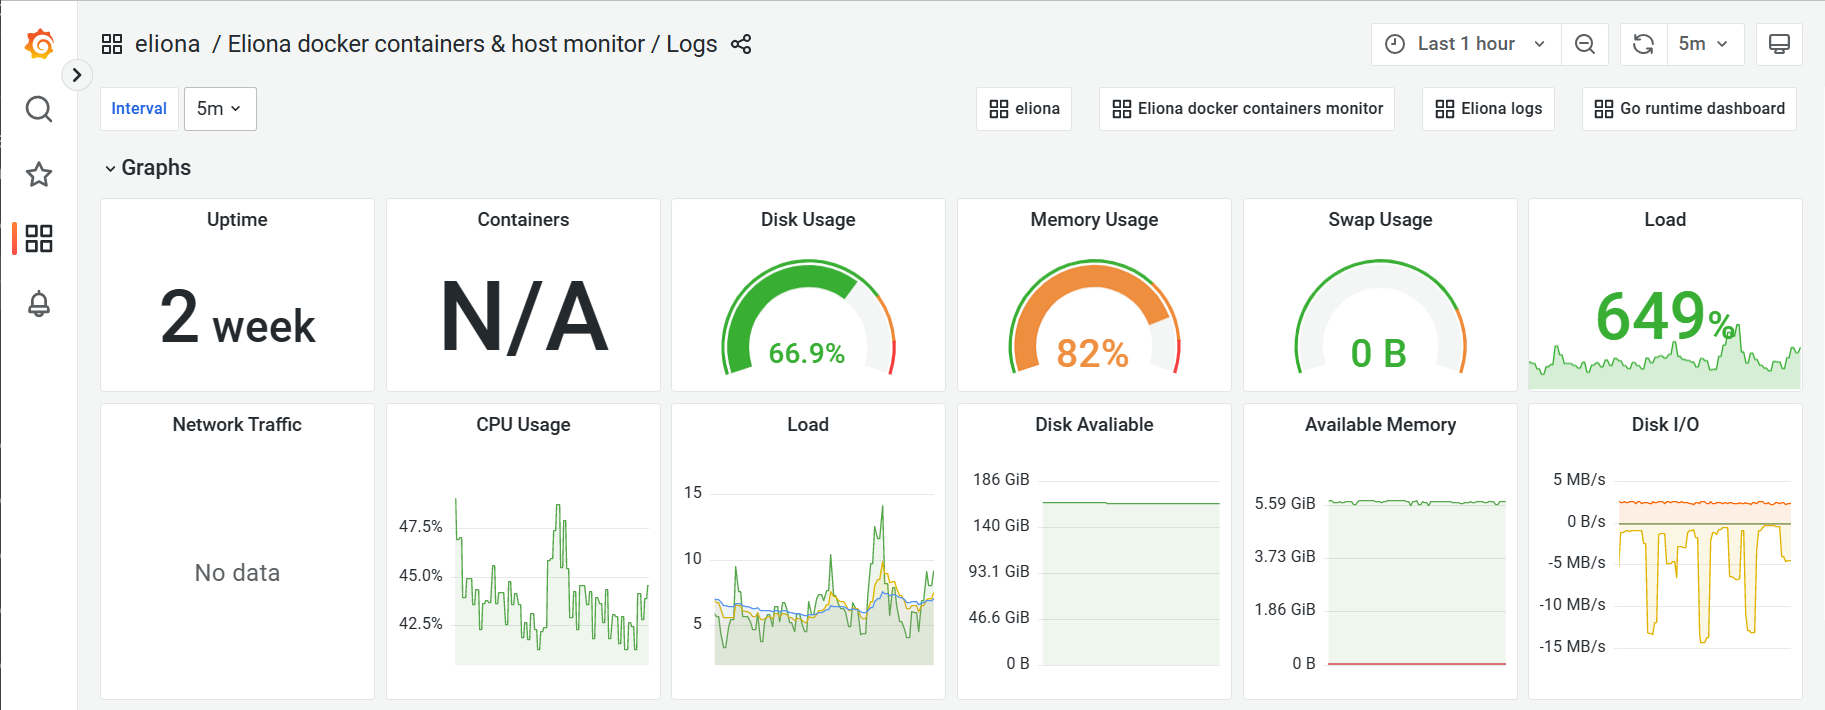
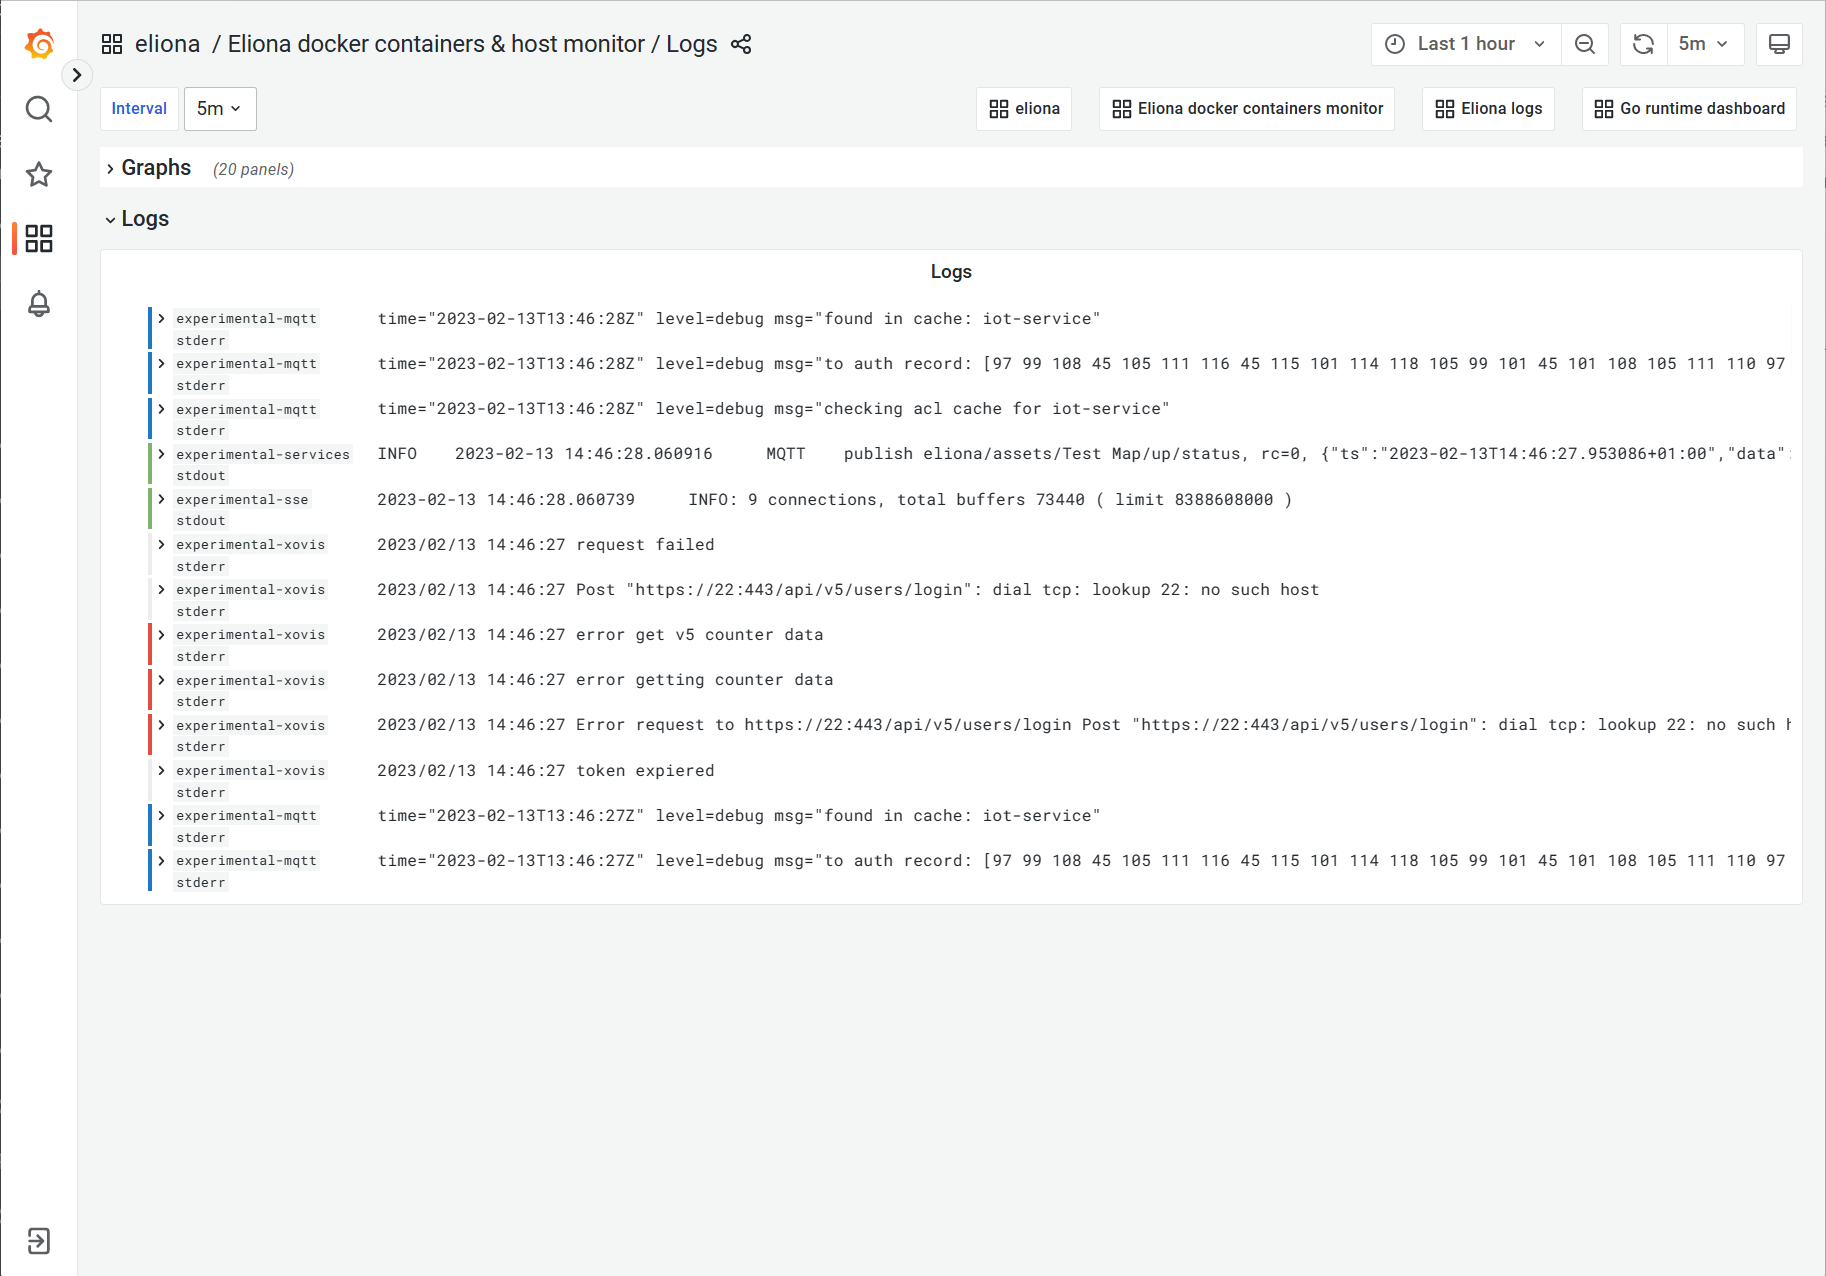
* **BuildingPro Suites Docker-Container- und Host-Monitor / Logs**: Grundlegende Metriken (RAM, CPU, Net) des Hosts und der BuildingPro Suites-Container sowie Log-Protokolle.
* **BuildingPro Suites Docker-Container- und Host-Monitor:** Grundlegende Metriken (RAM, CPU, Net) der BuildingPro Suites-Container.
* **BuildingPro Suites-Logs:** BuildingPro Suites-Logs mit Filtern
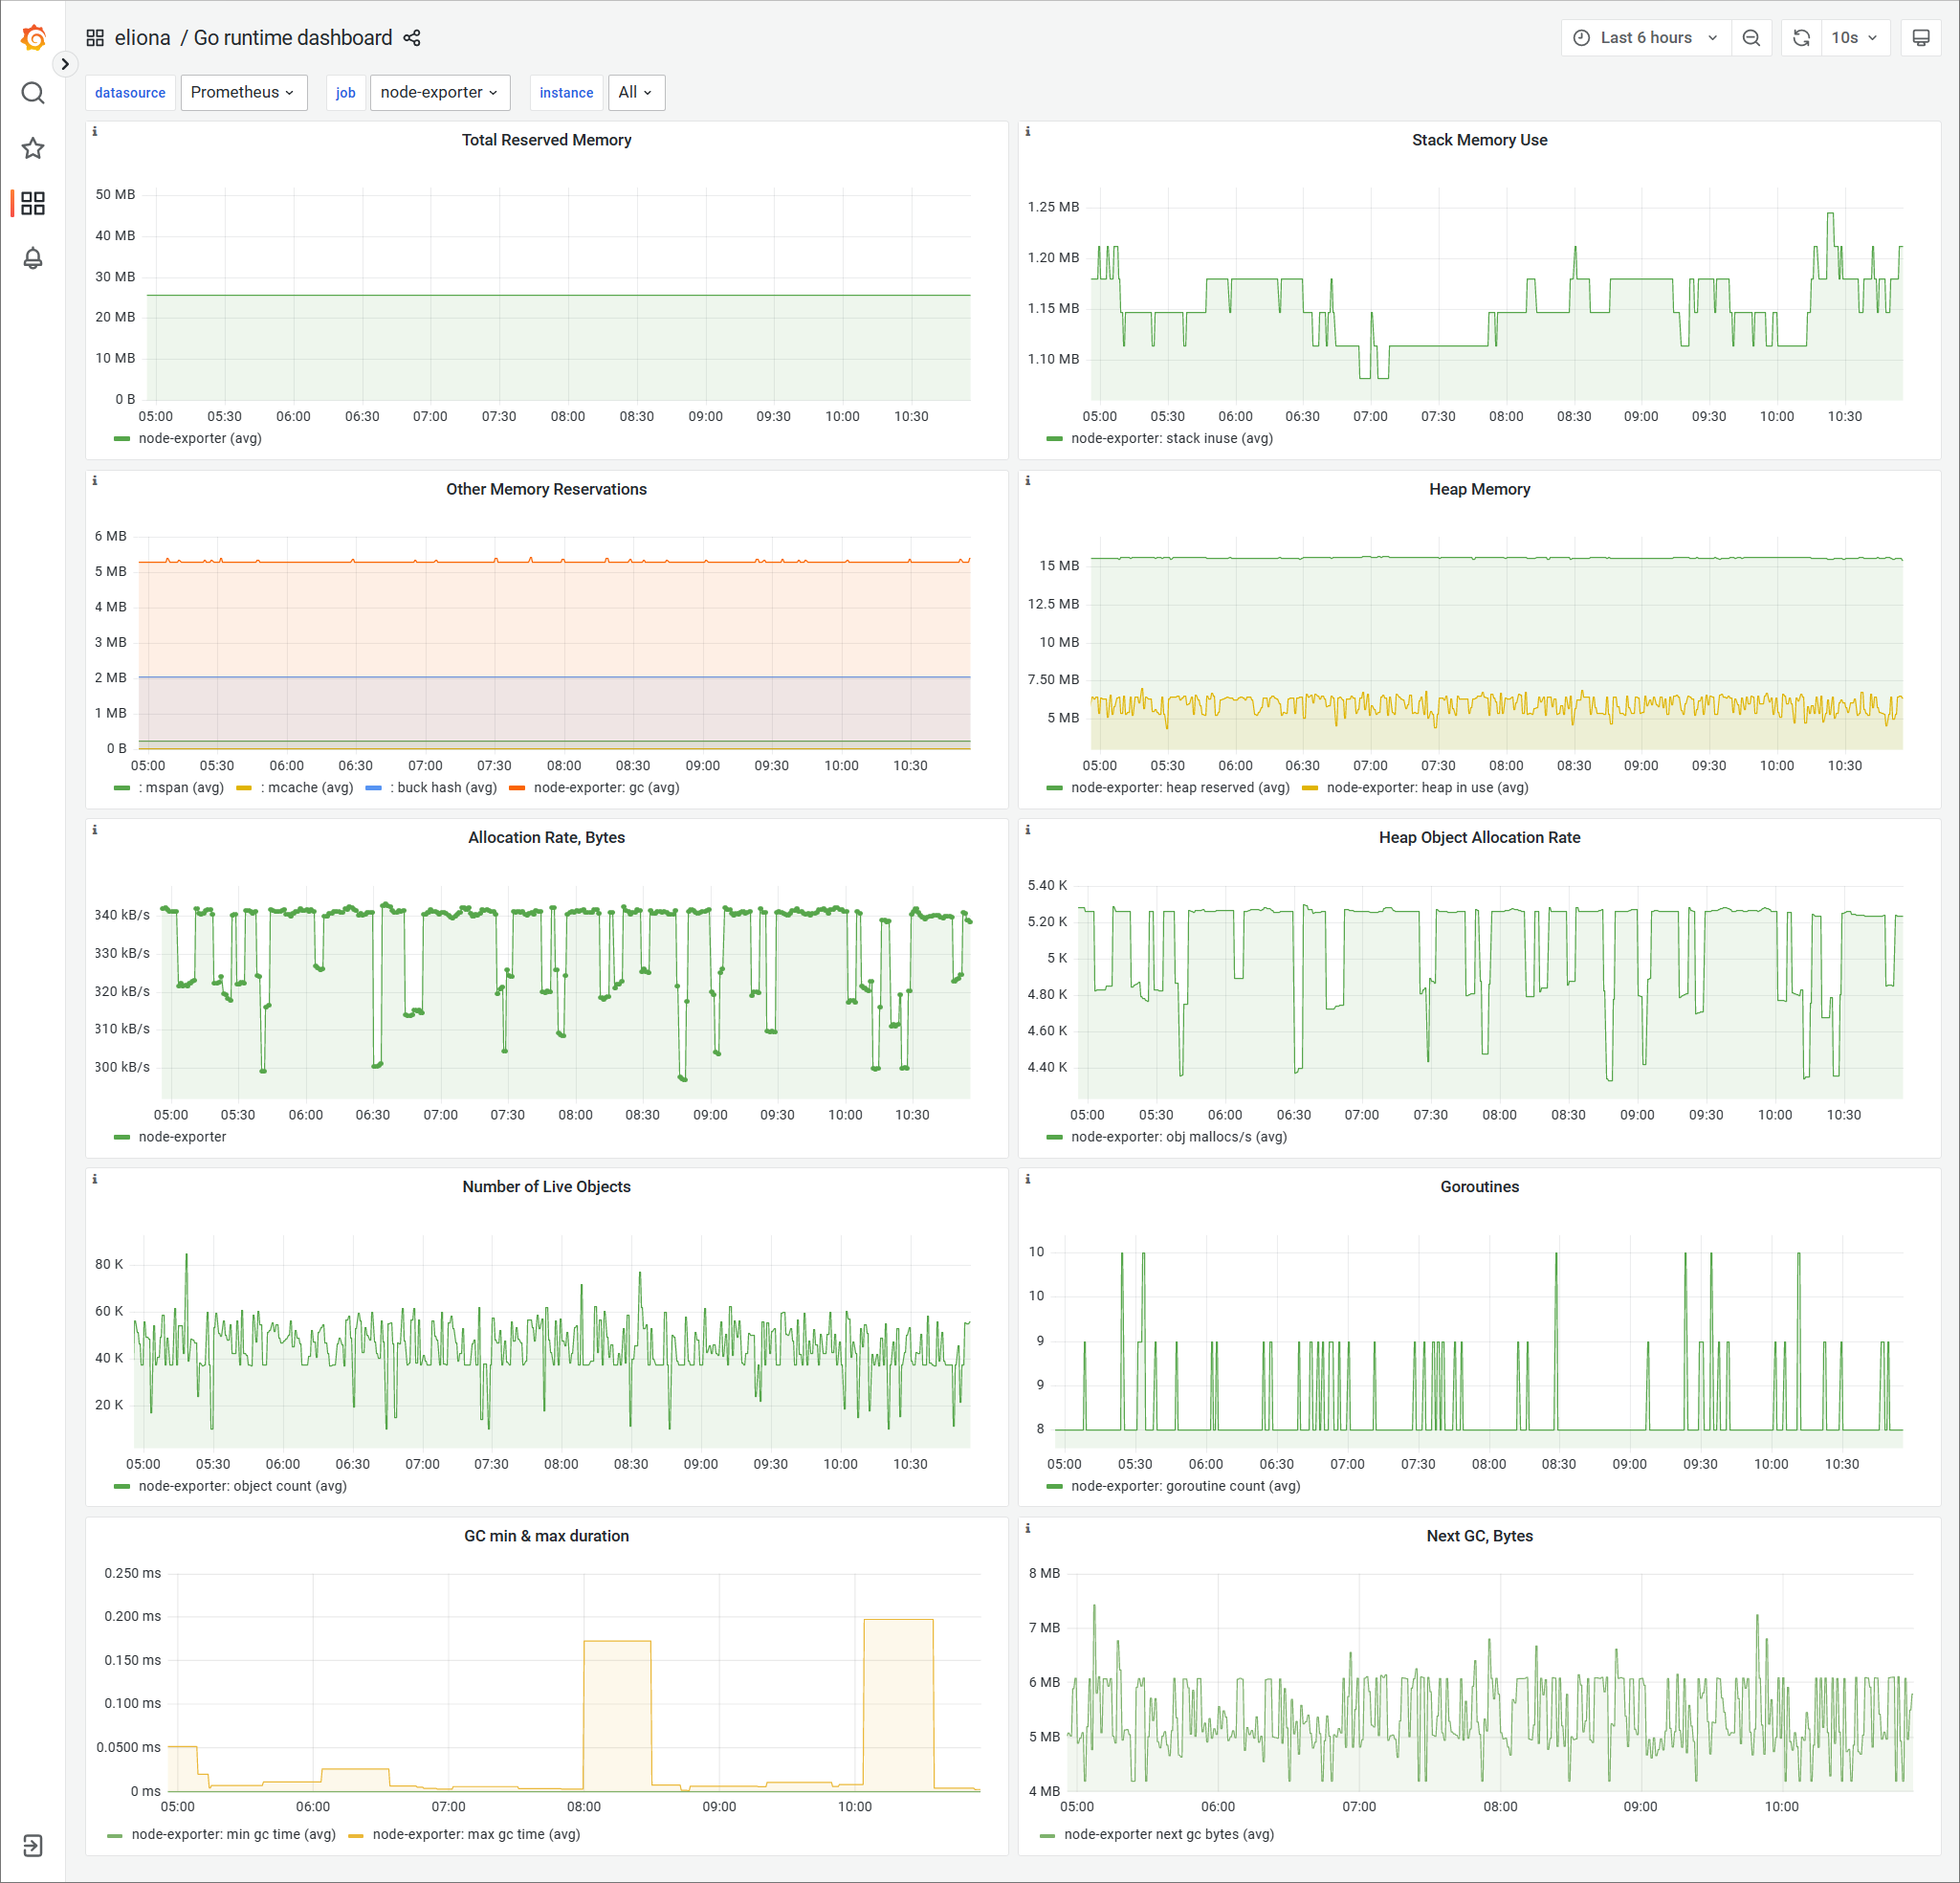
* **Go-Runtime-Dashboard:** Metriken der Go-Teile von BuildingPro Suites (Dienste, die mit Golang entwickelt wurden)
---
# Agent Instructions: Querying This Documentation
If you need additional information that is not directly available in this page, you can query the documentation dynamically by asking a question.
Perform an HTTP GET request on the current page URL with the `ask` query parameter:
```
GET https://docs.buildings.ability.abb/collection/german/for-developers/monitoring-with-grafana.md?ask=
```
The question should be specific, self-contained, and written in natural language.
The response will contain a direct answer to the question and relevant excerpts and sources from the documentation.
Use this mechanism when the answer is not explicitly present in the current page, you need clarification or additional context, or you want to retrieve related documentation sections.