> For the complete documentation index, see [llms.txt](https://docs.buildings.ability.abb/collection/llms.txt). Markdown versions of documentation pages are available by appending `.md` to page URLs; this page is available as [Markdown](https://docs.buildings.ability.abb/collection/platform/insight-analytics/analytics-types/single-forecast.md).
# Single forecast
### Overview
In [*Insight Analytics*](/collection/platform/insight-analytics.md), you can use the analytic type *Single forecast* to visualize the forecast of a selected attribute.
This view lets you:
* select an attribute to forecast
* extend the selected attribute with forecast values beyond the last measured point
* review the forecast confidence intervals
* save the analytic for reuse in dashboards and smart views with the [*Analytic widget*](/collection/platform/live-cockpit/widgets/predefined-widgets/analytic.md)
This analytic type is intended for quick visualization. It does not create a forecast attribute. To configure a fixed horizon, percentile, aggregation, and feature attributes for an operational forecast, use the [*Forecast Engine*](/collection/platform/platform-core/baseline-and-factors/forecast-engine.md).
### Open the *Single forecast* analytic type
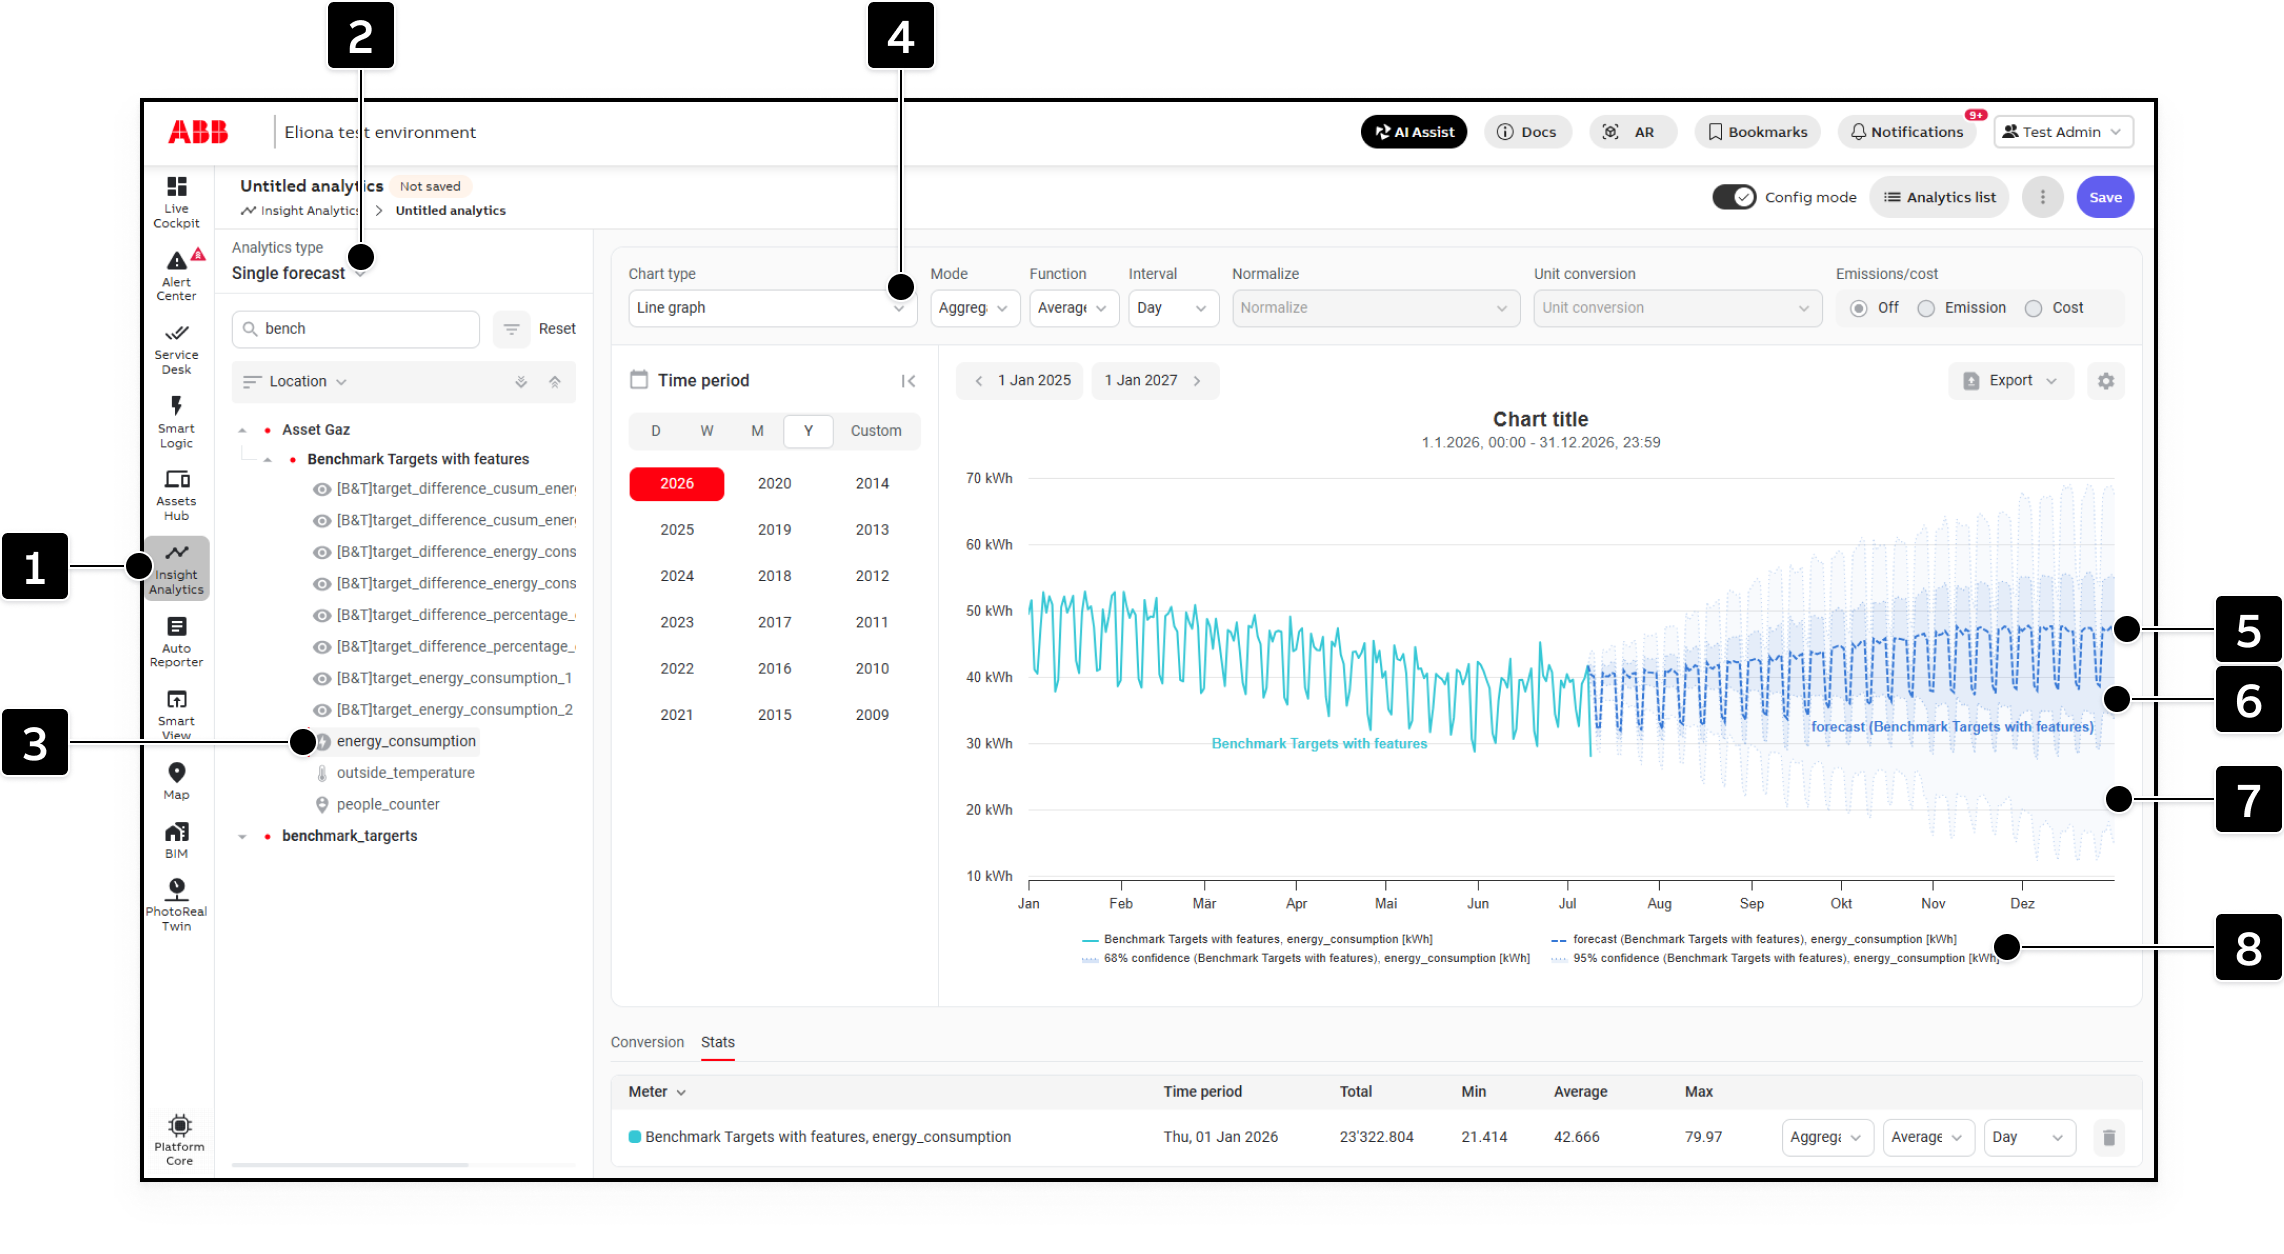
1. Open *Insight Analytics* **\[1]**.\
▷ The analytics interface opens.
2. In the **Analytics type** selector **\[2]**, select **Single forecast**.\
▷ The analytics view switches to forecast visualization.
3. In the asset tree, select the attribute you want to forecast under **\[3]**.\
▷ The chart is updated.
4. Under **\[4]**, select a line graph or bar graph.
### Understand the forecast chart
The chart shows the measured data together with the forecast.
The chart elements have the following meaning:
* **Solid line**: The measured data of the selected attribute
* **Forecast line \[5]**: The predicted future values starting after the last measured data point
* **One-sigma bound \[6]**: The narrower 68% confidence range
* **Two-sigma bound \[7]**: The wider 95% confidence range
* **Legend \[8]**: Identifies the measured series, forecast, and confidence ranges
The forecast is shown in a slightly different color from the measured values so that both can be distinguished more easily.
The forecast extends from the last measured point to the end of the currently visible chart range.
For the general visual treatment of future data in line and bar charts, see [Future data in charts](/collection/platform/insight-analytics/the-insight-analytics-interface/chart.md#future-data).
* The forecast does not replace or reinterpret the measured values.
* It continues the series from the last available measured value onward.
* The calculation uses the data in the chart and may include additional preceding data.
### Understand the confidence intervals
The forecast chart can show two confidence intervals around the forecast.
* **1 sigma confidence interval**\
The narrower expected range around the forecast.
* **2 sigma confidence interval**\
The wider expected range around the forecast.
◈ These intervals show how certain or uncertain the forecast is.\
◈ A narrower interval indicates lower uncertainty.\
◈ A wider interval indicates higher uncertainty.
### Save the analytic
1. Click on **Save**.\
▷ The current analytic is saved.
◈ Saved analytics can be used later in dashboards or smart views with the [*Analytic widget*](/collection/platform/live-cockpit/widgets/predefined-widgets/analytic.md).\
◈ Existing analytics can also be added to [reports](/collection/platform/analytics-and-reports/use-reports.md).
### Notes
* The analytic type *Single forecast* is part of [*Insight Analytics*](/collection/platform/insight-analytics.md).
* Saved analytics can be reused in dashboards or smart views with the [*Analytic widget*](/collection/platform/live-cockpit/widgets/predefined-widgets/analytic.md), or added to [reports](/collection/platform/analytics-and-reports/use-reports.md).
* If required, adjust the chart options and visible time period to review the forecast in the desired level of detail \[1].
---
# Agent Instructions
This documentation is published with GitBook. GitBook is the documentation platform designed so that both humans and AI agents can read, navigate, and reason over technical content effectively. Learn more at gitbook.com.
## Querying This Documentation
If you need additional information that is not directly available in this page, you can query the documentation dynamically by asking a question.
Perform an HTTP GET request on the current page URL with the `ask` query parameter, and the optional `goal` query parameter:
```
GET https://docs.buildings.ability.abb/collection/platform/insight-analytics/analytics-types/single-forecast.md?ask=&goal=
```
`ask` is the immediate question: it should be specific, self-contained, and written in natural language.
`goal` is optional and describes the broader end goal you are ultimately trying to accomplish on behalf of the user. GitBook uses it to tailor the answer towards what is most useful for that goal.
The response will contain a direct answer to the question and relevant excerpts and sources from the documentation.
Use this mechanism when the answer is not explicitly present in the current page, you need clarification or additional context, or you want to retrieve related documentation sections.