# Trend

With the "Trend" module, you can display trends in a widget. The module provides you with extensive options for configuring trends.

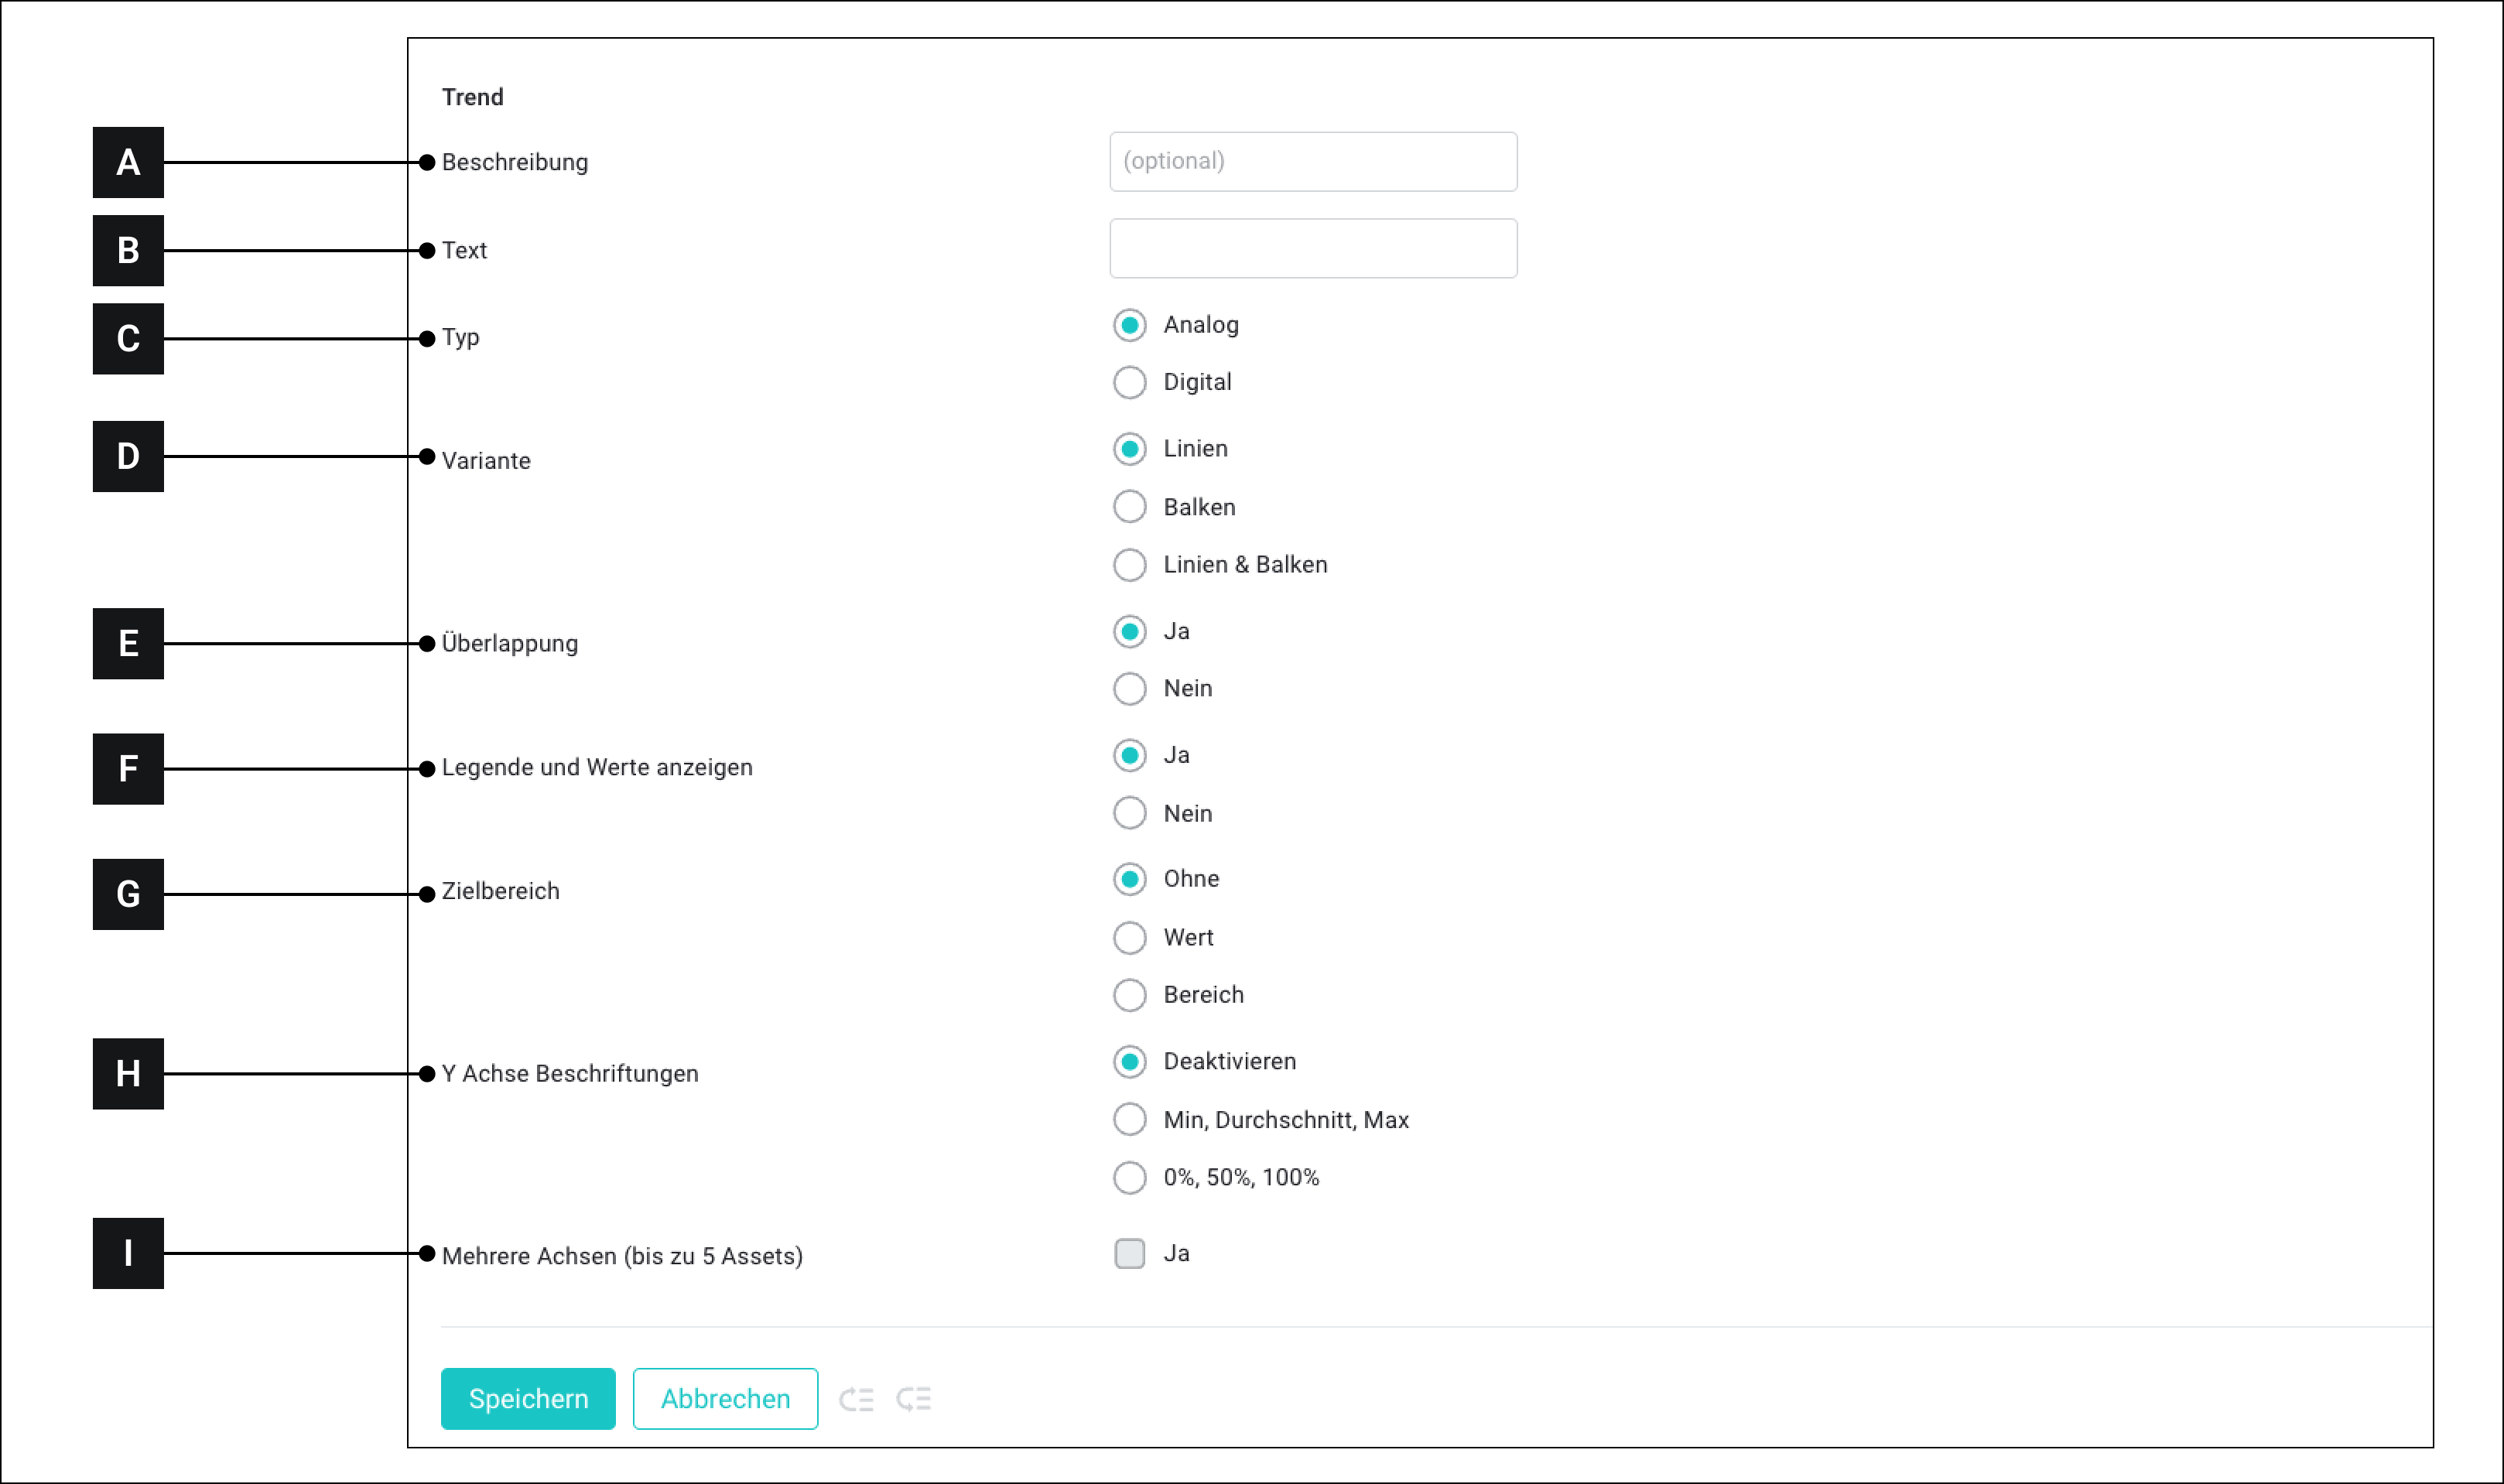
<figure><img src="https://3489494878-files.gitbook.io/~/files/v0/b/gitbook-x-prod.appspot.com/o/spaces%2F9GvUpaatBiReR43XFSMg%2Fuploads%2F27VZ210mHwX4TQccdbbc%2FDC3160C3-89EF-458C-9218-075C84D0A0E7.png?alt=media&#x26;token=ccd1d301-7453-4c7e-8d1b-ec9fc3c95aac" alt=""><figcaption><p>The configuration options for the "Trend" module</p></figcaption></figure>

<table data-full-width="true"><thead><tr><th width="71.13329060872394"></th><th width="125.20001220703125"></th><th></th></tr></thead><tbody><tr><td><strong>[A]</strong></td><td>Description</td><td>This text is displayed when the custom widget is later connected to assets.</td></tr><tr><td><strong>[B]</strong></td><td>Text</td><td>Free text</td></tr><tr><td><strong>[C]</strong></td><td>Type</td><td><ul><li><strong>Digital:</strong> Select the "Digital" type if you want to track the history of an asset that sends values between 0 and 1, e.g., a contact sensor.</li><li><strong>Analog:</strong> Select the "Analog" type if you want to track the history of an asset that sends values other than 0 and 1, especially floating-point numbers.<br>This includes most assets that have other statuses than "On" and "Off", e.g., temperature sensors.</li></ul></td></tr><tr><td><strong>[D]</strong></td><td>Variant</td><td>Choose whether the data should be displayed as a line chart, bar chart, or both.</td></tr><tr><td><strong>[E]</strong></td><td>Overlap</td><td><p>Possible options:</p><ul><li><strong>Yes</strong>: all parameters are displayed in one row.</li><li><strong>No</strong>: Each parameter is displayed in a separate row</li></ul></td></tr><tr><td><strong>[F]</strong></td><td>Legend and values</td><td><p>Possible options:</p><ul><li><strong>Yes</strong>: Each parameter is explicitly displayed with its name and a numerical value.</li><li><strong>No</strong>: Neither the value nor the title is displayed.</li></ul><p>Whether the current value or the aggregated value is displayed for a parameter can be selected when an asset is connected to the widget.</p></td></tr><tr><td><strong>[G]</strong></td><td>Target range</td><td>The information for the target range can be entered when the custom widget is later connected to assets.</td></tr><tr><td><strong>[H]</strong></td><td>Y-axis label</td><td>Indicates whether a label should be displayed on the Y-axis.</td></tr><tr><td><strong>[i]</strong></td><td>Multiple axes</td><td><p>Should only be activated if:</p><ul><li>"Overlap" is set to "Yes"</li><li>"Y-axis label" is set to "Min, Average Max"</li></ul></td></tr></tbody></table>


---

# Agent Instructions: Querying This Documentation

If you need additional information that is not directly available in this page, you can query the documentation dynamically by asking a question.

Perform an HTTP GET request on the current page URL with the `ask` query parameter:

```
GET https://docs.buildings.ability.abb/collection/platform/live-cockpit/widgets/custom-widgets/modules/trend.md?ask=<question>
```

The question should be specific, self-contained, and written in natural language.
The response will contain a direct answer to the question and relevant excerpts and sources from the documentation.

Use this mechanism when the answer is not explicitly present in the current page, you need clarification or additional context, or you want to retrieve related documentation sections.
