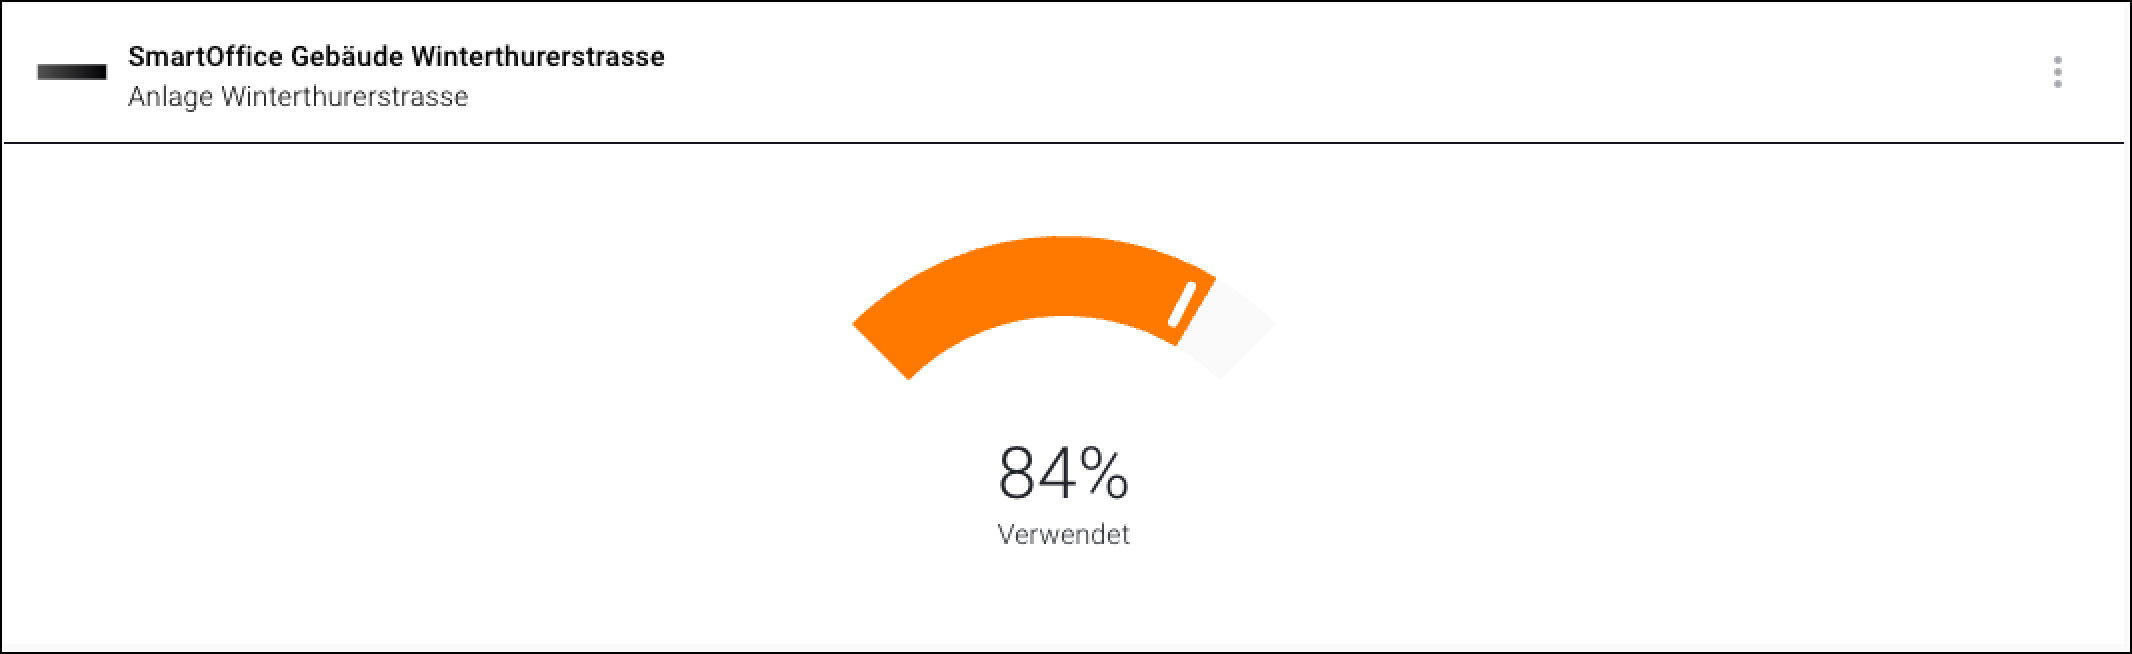
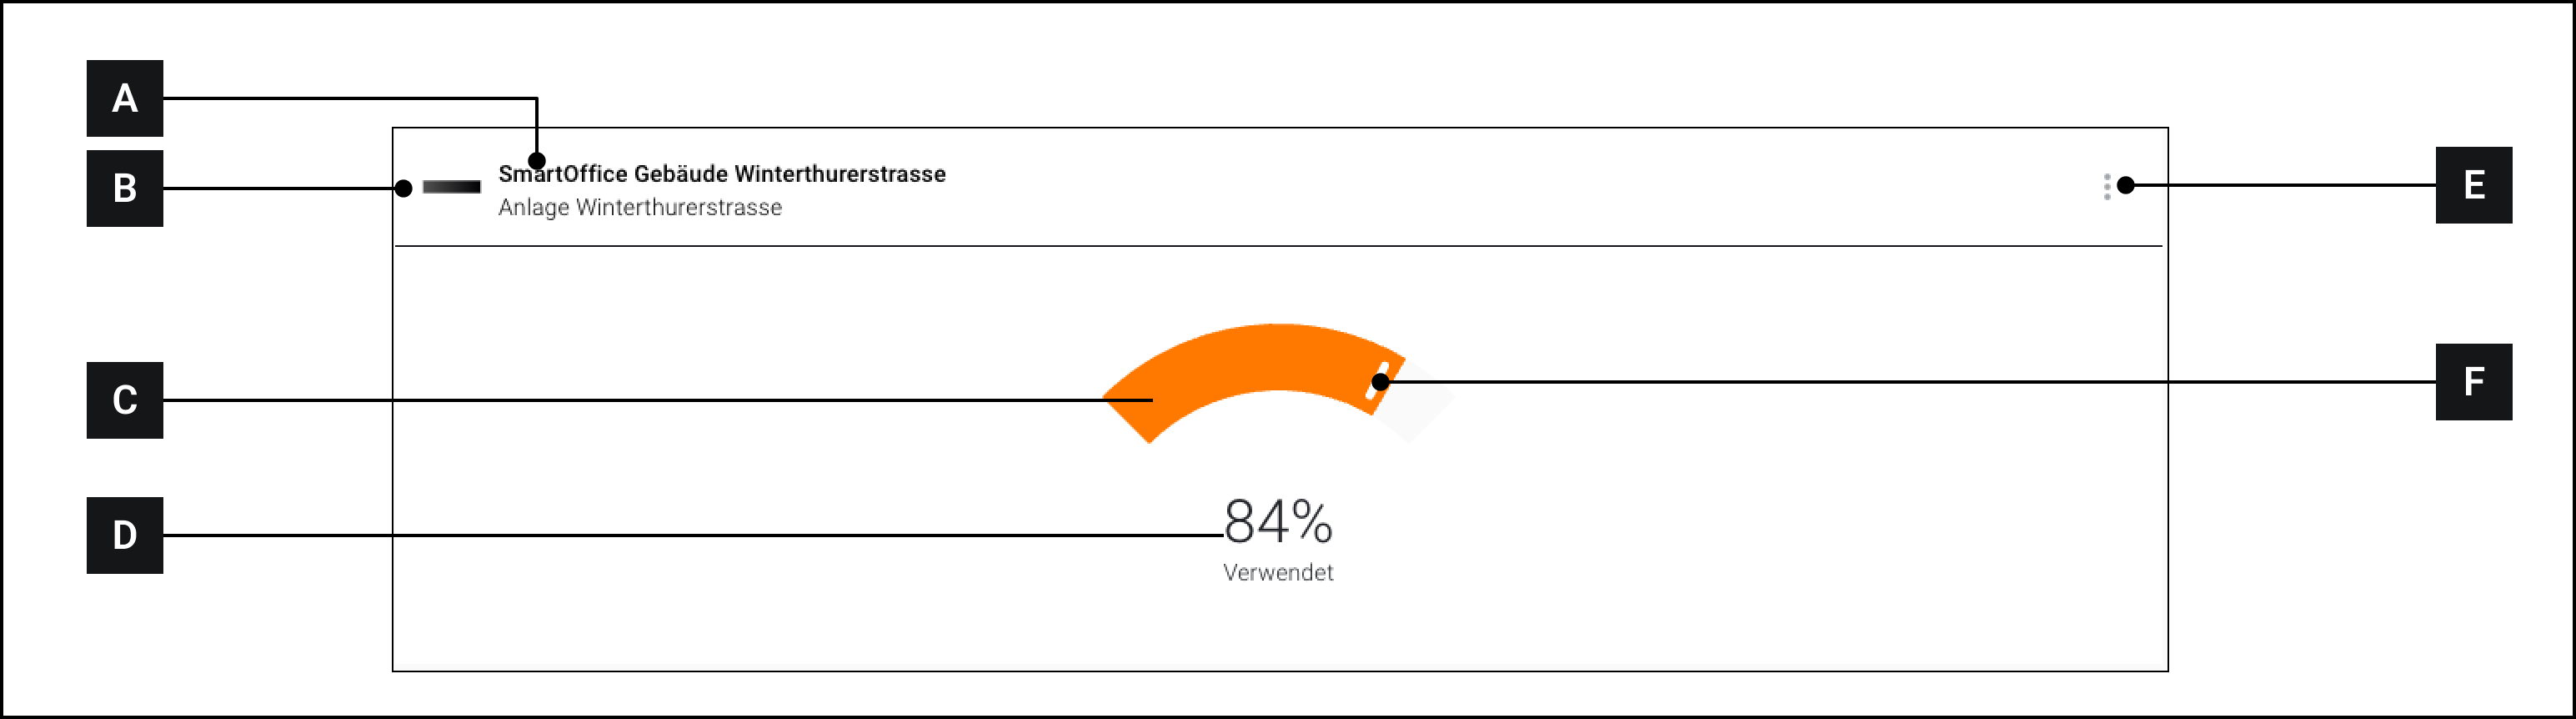
# Radial Progress

The "Radial Progress" widget displays a progress or fill level.

<figure><img src="https://3489494878-files.gitbook.io/~/files/v0/b/gitbook-x-prod.appspot.com/o/spaces%2F9GvUpaatBiReR43XFSMg%2Fuploads%2FUVibpOvegjaiX8vI1eM1%2FC6C8CF3E-F344-43D6-A602-A33AD446E1BA.png?alt=media&#x26;token=88d0c15f-cfba-4794-823a-6ae2a8da48e4" alt=""><figcaption></figcaption></figure>

## Difference from "Vertical Progress" Widget

An optimal value can be specified. If this optimal value is exceeded, the display turns orange.

## Configure Widget

<figure><img src="https://3489494878-files.gitbook.io/~/files/v0/b/gitbook-x-prod.appspot.com/o/spaces%2F9GvUpaatBiReR43XFSMg%2Fuploads%2FNfQkhK461EMneqrvt3KY%2F5162D888-F05B-48FA-BF44-0485FD8CB7F3.png?alt=media&#x26;token=d177b8ad-1b46-4a85-b8c9-4ccb616f4470" alt=""><figcaption></figcaption></figure>

1. Make sure you are in the "Dashboard" menu
2. Click on "Add widget"
3. Click on "Input"
4. Click on "Radial Progress"
5. Select the primary asset. The name of this asset will appear in the title bar of the widget.
6. Select the asset you want to monitor.
7. Select an attribute
8. Enter an optimal value
9. Enter a maximum value
10. Click on "Add widget"

## Overview

<figure><img src="https://3489494878-files.gitbook.io/~/files/v0/b/gitbook-x-prod.appspot.com/o/spaces%2F9GvUpaatBiReR43XFSMg%2Fuploads%2FIh2k8eM3muS1HEWQ3nDD%2F9422EFBF-FE9C-4DD5-8290-863388086BF7.png?alt=media&#x26;token=873da9bb-50ff-457a-a8ec-1c8eb1c4da67" alt=""><figcaption></figcaption></figure>

<table data-full-width="true"><thead><tr><th width="67.93333943684894"></th><th width="236.4000244140625"></th><th></th></tr></thead><tbody><tr><td><strong>[A]</strong></td><td>Title bar</td><td>Name of the primary asset</td></tr><tr><td><strong>[B]</strong></td><td>Icon</td><td></td></tr><tr><td><strong>[C]</strong></td><td>Progress indicator</td><td>Displays the progress visually</td></tr><tr><td><strong>[D]</strong></td><td>Current value</td><td>Displays the current value in percent</td></tr><tr><td><strong>[E]</strong></td><td>More options</td><td>Displays more options</td></tr><tr><td><strong>[F]</strong></td><td>Optimal value marker</td><td>If this value is exceeded, the progress indicator turns orange</td></tr></tbody></table>
