For the complete documentation index, see llms.txt. This page is also available as Markdown.

Create a New Forecast

Create a forecast to generate a continually updated forecast attribute from a selected source attribute and optional contextual features.

Before you begin, open the Forecast Engine and click on Add Forecast.

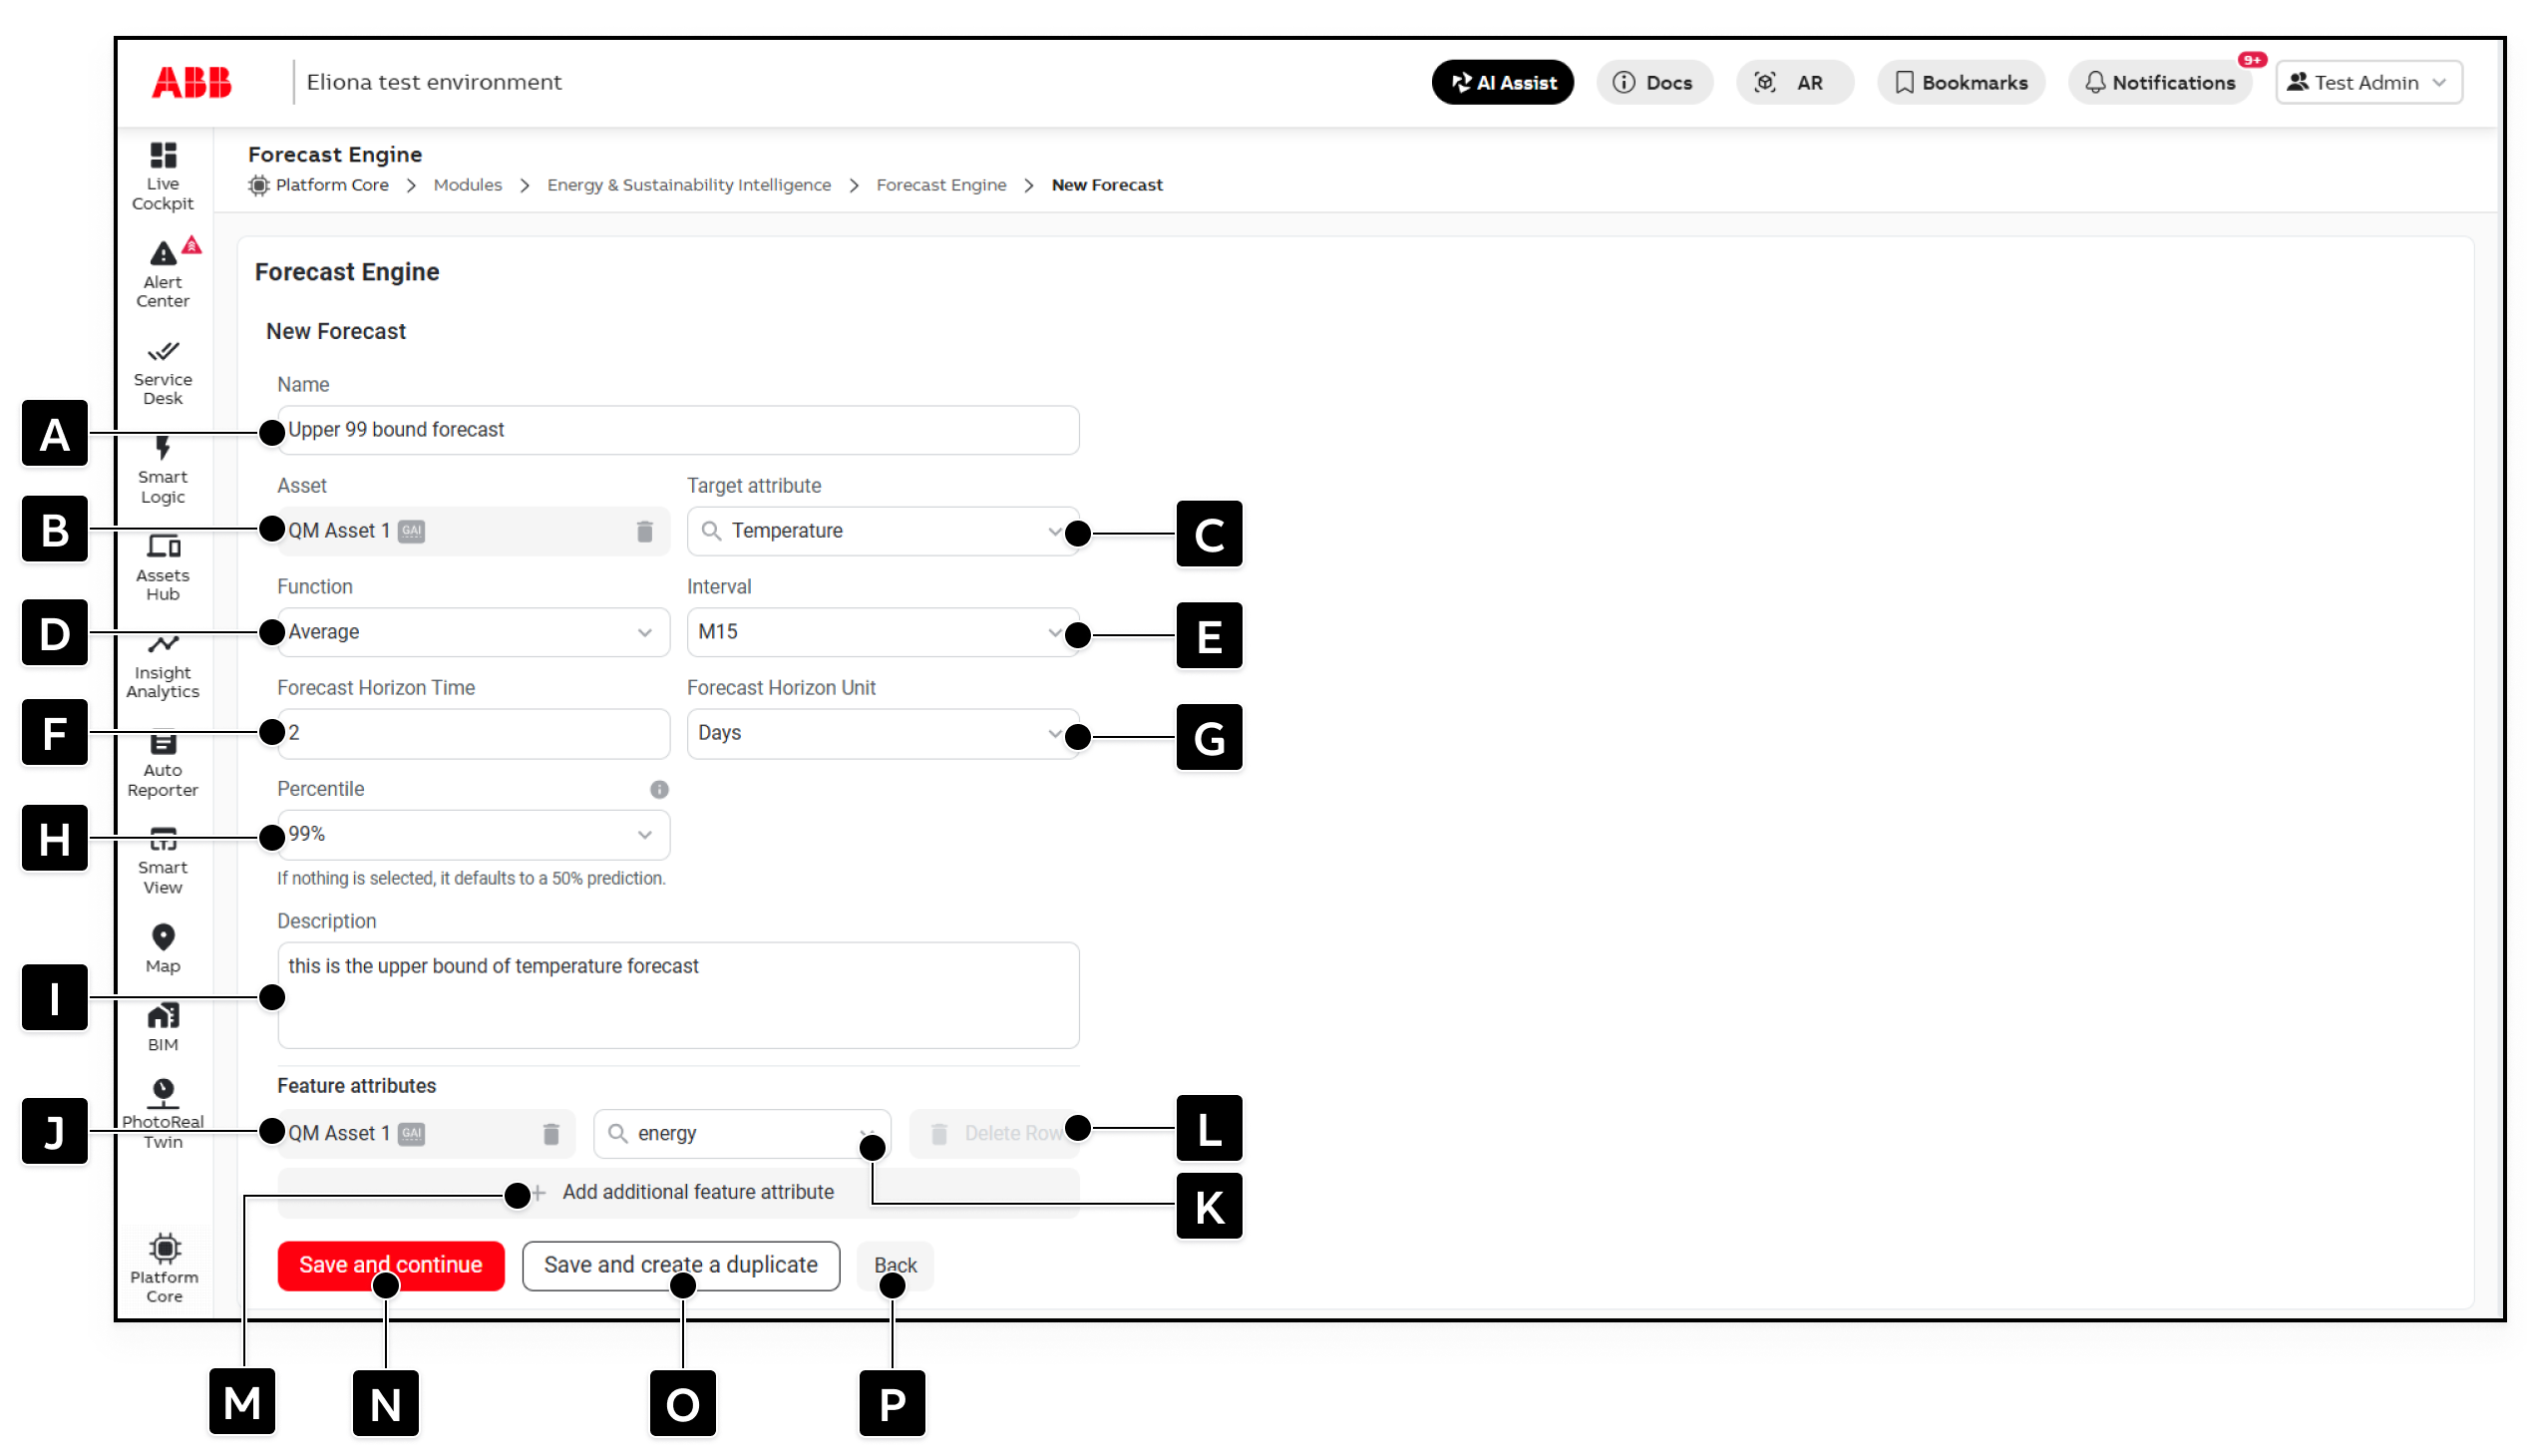
The New Forecast page with configuration fields A through P marked

Configuration Fields

[A]

Name

Name of the forecast. This is also the displayed name of the forecast attribute created on the selected asset.

[B]

Asset

Asset that contains the target data and on which the forecast attribute is created.

[C]

Target attribute

Source attribute containing the time series to forecast.

[D]

Function

Aggregation applied to the source data before forecasting. Available functions include Average, Time-weighted average, Sum, Counter, CUSUM counter, Minimum, and Maximum.

[E]

Interval

Time interval over which source values are aggregated.

[F]

Forecast Horizon Time

Number of horizon units to forecast into the future.

[G]

Forecast Horizon Unit

Unit used for the forecast horizon. Together, [F] and [G] define how far ahead the forecast is calculated.

[H]

Percentile

Probability percentile calculated by this forecast. If no percentile is selected, the forecast defaults to 50%.

[I]

Description

Optional description of the forecast and its purpose.

[J]

Feature asset

Asset containing a feature attribute used as additional forecasting context.

[K]

Feature attribute

Attribute whose data can improve the forecast by describing a factor related to the target.

[L]

Delete Row

Removes the corresponding feature attribute row.

[M]

Add additional feature attribute

Adds another feature attribute row.

[N]

Save and continue

Saves the forecast and returns to the forecast list.

[O]

Save and create a duplicate

Saves the forecast and opens a copy as the basis for another forecast.

[P]

Back

Returns to the forecast list without saving the current changes.

Configure the Forecast

  1. Enter a unique forecast name under [A]. ◈ The system uses this name as the displayed name of the generated attribute.

  2. Select the asset under [B] and the target attribute under [C].

  3. Select the aggregation function under [D] and its interval under [E]. ◈ For example, Average with an interval of 15 minutes forecasts values based on 15-minute averages.

  4. Enter the horizon length under [F] and select its unit under [G]. ◈ A value of 1 with the unit Days forecasts one day into the future.

  5. Select the percentile under [H].

  6. If required, enter a description under [I].

  7. If relevant contextual data is available, select a feature asset under [J] and a feature attribute under [K].

  8. To include more context, click on [M] and configure another feature row. ◈ To remove a row, click on [L].

  9. Complete the configuration with one of the following actions:

    • Click on [N] to save and return to the list.

    • Click on [O] to save and create a duplicate.

    • Click on [P] to return to the list without saving.

Understand Percentiles

A percentile forecast expresses uncertainty as a probability-based estimate rather than treating the future as one exact outcome.

  • 10%: Lower estimate; 10% of modeled outcomes are expected at or below this value.

  • 50%: Median estimate; half of modeled outcomes are expected below and half above this value.

  • 90%: Upper estimate; 90% of modeled outcomes are expected at or below this value.

Configuring several forecasts for the same target with different percentiles provides an operating range. Comparing a lower, median, and upper estimate can reveal possible spikes, show their likelihood, and provide a fuller view of expected healthy operation.

A percentile is not a certainty. For example, a 95th-percentile forecast indicates that approximately 95% of modeled outcomes are expected at or below that value and approximately 5% above it.

Select Useful Feature Attributes

Feature attributes provide context that may improve forecast accuracy. When forecasting energy consumption, useful features can include:

  • outside temperature

  • people count or occupancy

  • equipment operating mode

  • temperature setpoint

  • another control value that influences demand

Choose features that are available for the relevant period and have a meaningful relationship with the target. Adding unrelated features does not necessarily improve accuracy.

After saving, the Forecast Engine creates the forecast attribute and updates it on each forecast iteration. The value written is the predicted value at the end of the configured horizon; the complete future trend is recalculated as new data arrives.

Last updated