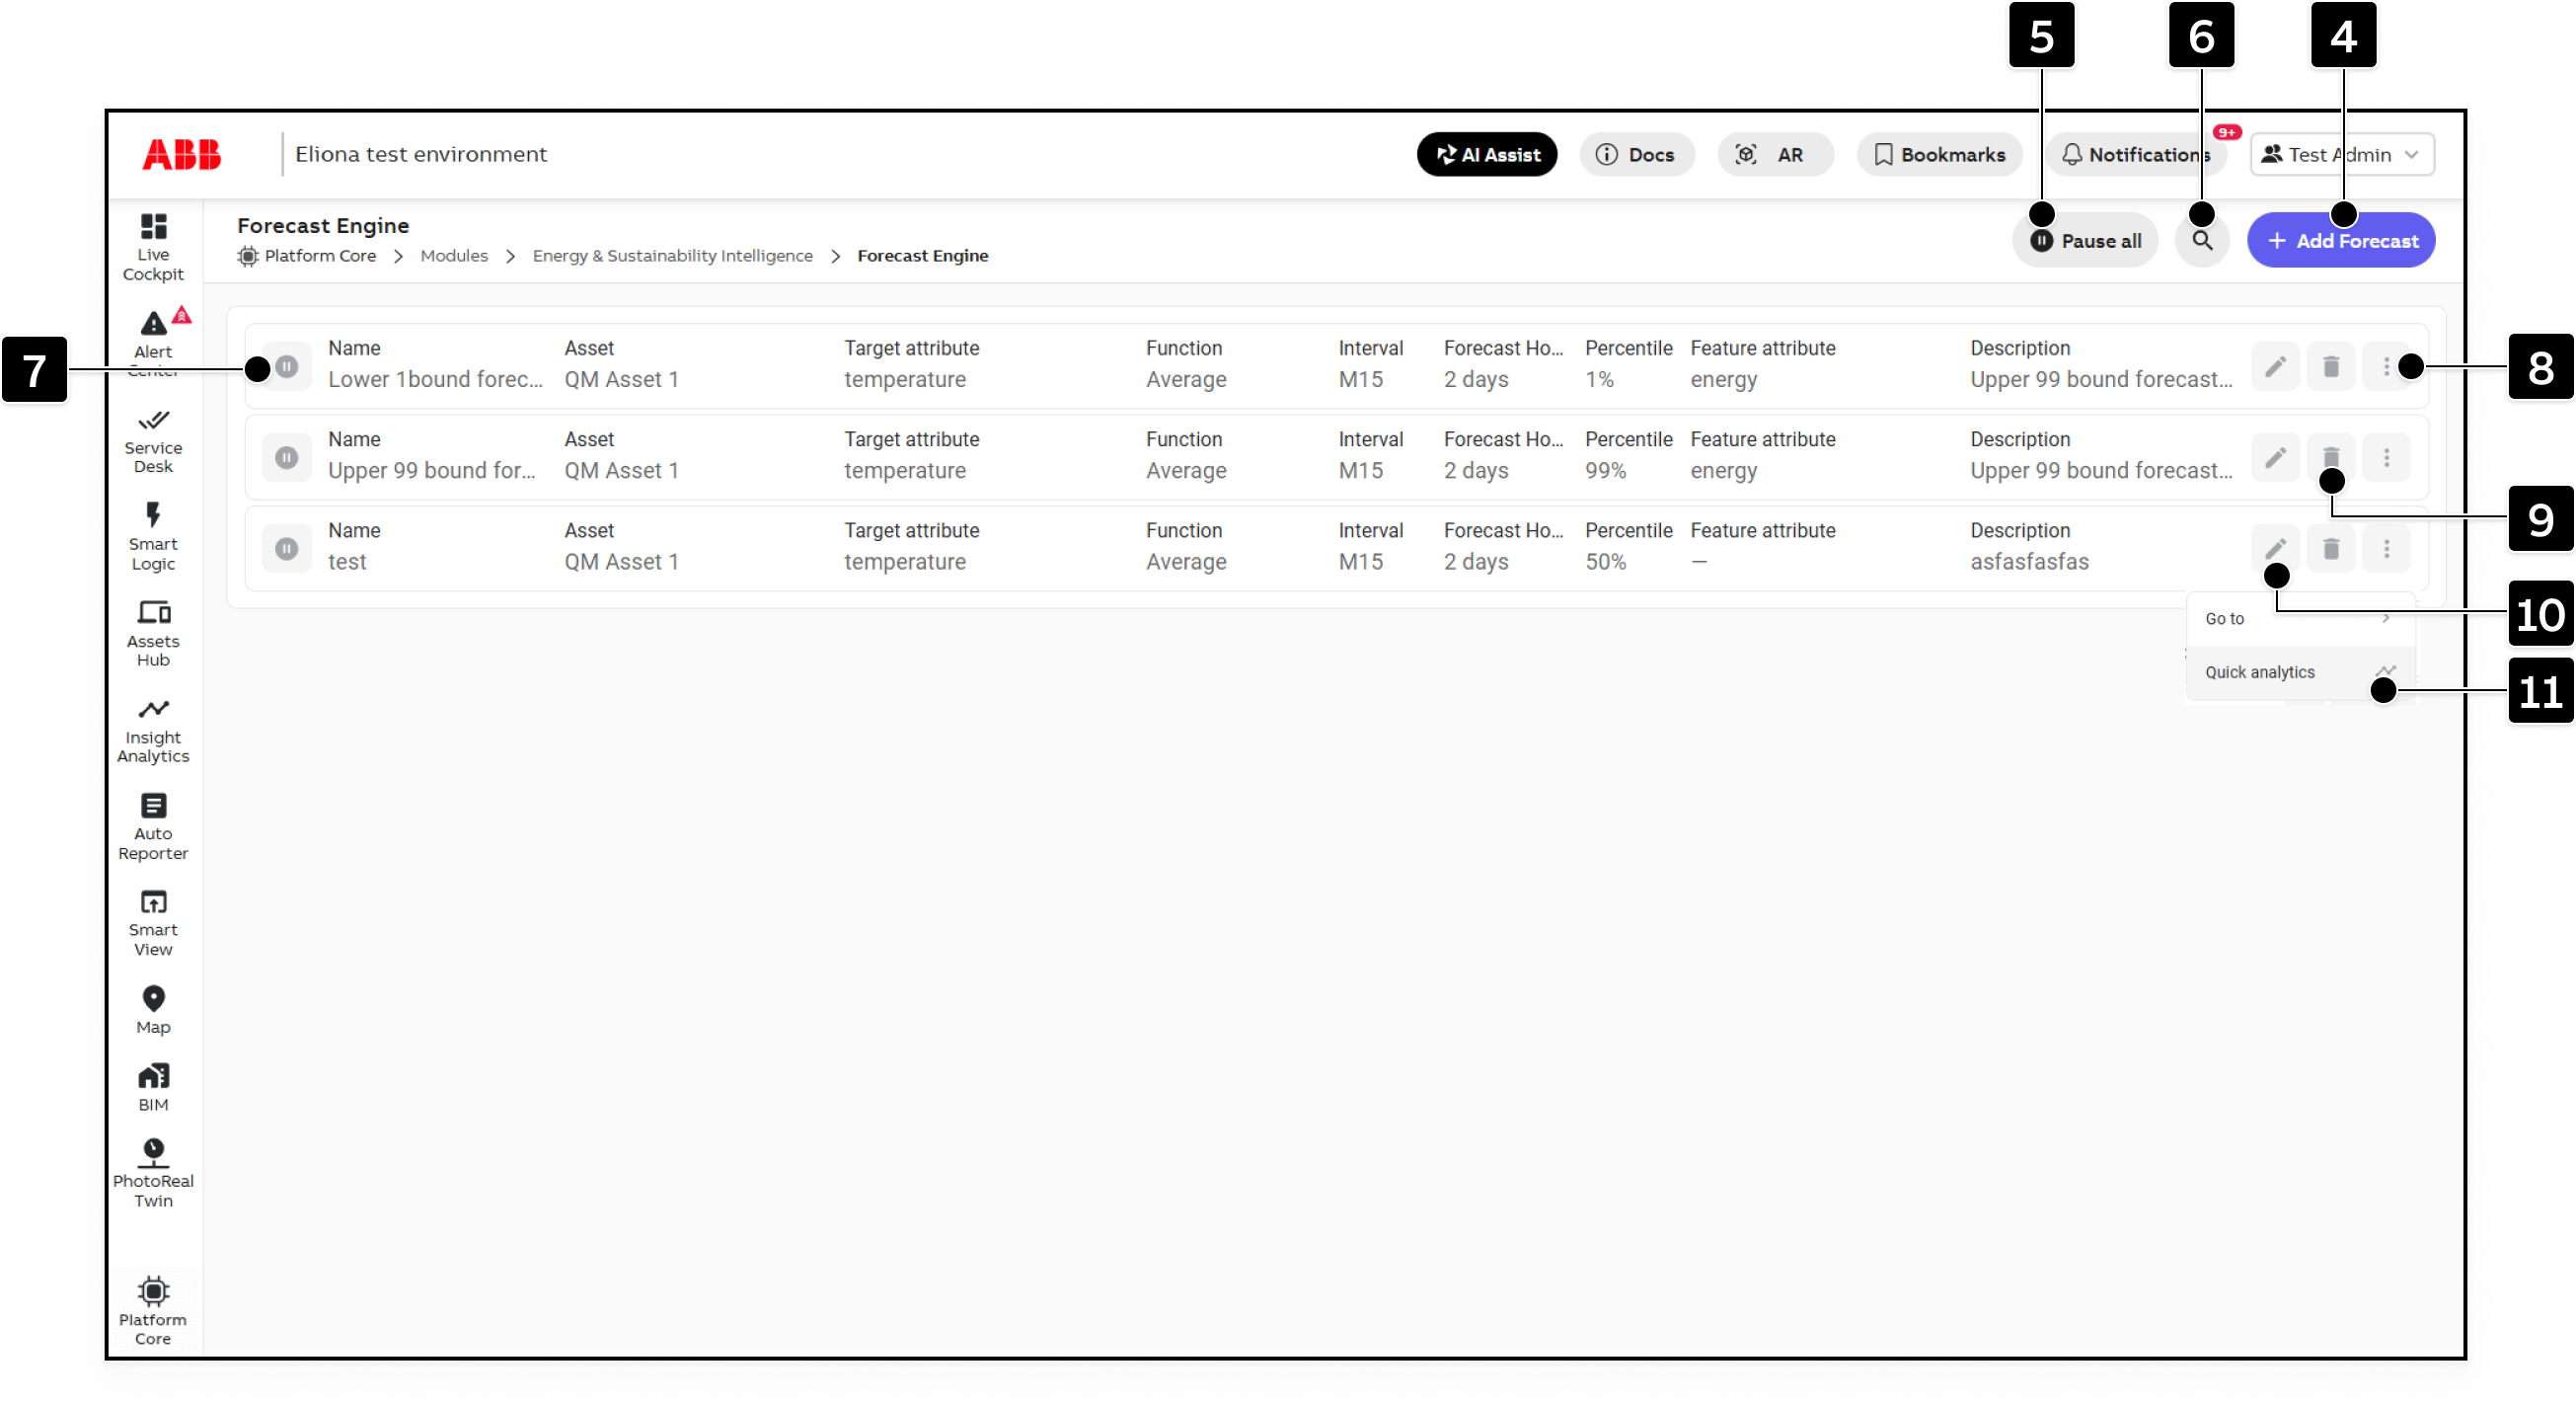
Manage Forecasts
The Forecast Engine list displays every configured forecast and provides controls for activation, editing, deletion, filtering, and visualization.

[4]
Add Forecast
Opens the configuration page for a new forecast.
[5]
Pause all / Activate all
Pauses or activates all configured forecasts.
[6]
Filter
Opens the filter sidebar for narrowing the forecast list.
[7]
Pause / Activate
Pauses or activates one forecast.
[8]
More actions
Opens additional actions for the corresponding forecast.
[9]
Delete
Deletes the corresponding forecast.
[10]
Edit
Opens the corresponding forecast configuration.
[11]
Quick analytics
Opens Quick analytics for the associated asset.
Activate or Pause Forecasts
Click on [5] to pause or activate all forecasts.
Click on [7] to pause or activate one forecast.
Pausing a forecast stops its forecast updates until it is activated again.
Find and Open Forecasts
Click on [6] to open the filter sidebar.
Apply the required filter criteria. ▷ The list shows the matching forecasts.
To open the asset associated with a forecast, click on [8] and select the asset navigation action.
Visualize Configured Forecast Attributes
A configured forecast creates an attribute on its selected asset. To visualize it, open Insight Analytics and select the generated forecast attribute in the asset tree, just as you would select any other attribute.
You can select the measured source attribute and several forecast attributes together. For example, compare the measured energy consumption with its 10th-, 50th-, and 90th-percentile forecast attributes to display the expected range.
This normal attribute visualization is separate from the Single forecast analytic type, which calculates a temporary forecast directly in a chart.
Edit or Delete a Forecast
Click on [10] to edit a forecast.
Click on [9] to delete a forecast.
Deleting a forecast removes its configuration. Confirm that rules, widgets, or other workflows no longer depend on its generated attribute before deleting it.
Last updated

